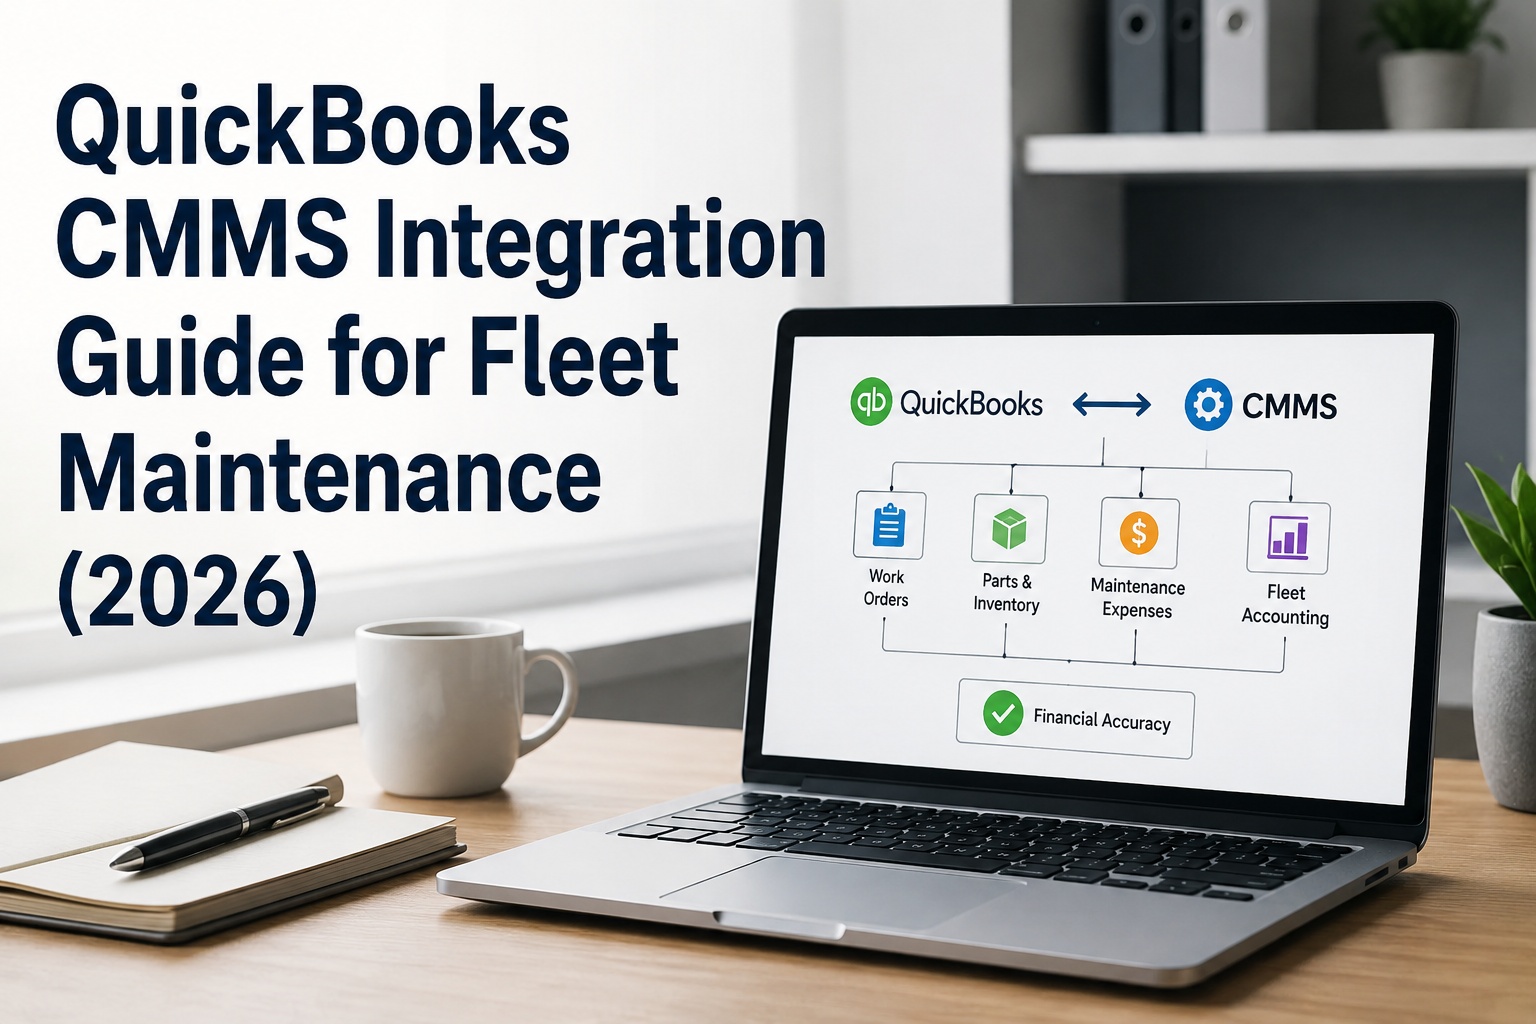
The single most expensive thing a fleet CFO handles every month isn't a truck repair — it's the reconciliation. Work orders in the CMMS. Vendor bills in QuickBooks. Parts consumed on one side, GL entries on the other. Someone is manually stitching them together, and every hour of that work is a decision the finance team isn't making. This QuickBooks CMMS integration guide walks the sync architecture, the chart-of-accounts mapping, and the six data streams that actually matter — or book a 15-min HVI demo to see it live.
The QuickBooks × HVI Sync Map
Every data stream that has to move between maintenance and accounting — and how each one lands in the right GL account, on the right asset, on the right day.
A QuickBooks CMMS integration is a real-time data bridge between a fleet maintenance system and QuickBooks Online or Desktop. When configured well, it moves six data streams automatically: work orders become bills, parts consumed become inventory adjustments, vendors sync as vendor-master records, labor hours land in job cost or payroll, capital component costs flow to the fixed-asset register, and maintenance categories map once to your chart of accounts so every dollar lands in the correct GL sub-account. The payoff for finance: manual reconciliation goes from 30–40% of a bookkeeper's week to essentially zero — and cost-per-asset visibility becomes real, not estimated.
Every fleet has the same shape of accounting problem. The maintenance data lives in the CMMS — work orders, parts, labor, vendors. The books live in QuickBooks — bills, GL entries, depreciation schedules. Someone in between is copying, categorizing, and hoping nothing missed. That "someone" is where fleets bleed accuracy: mis-coded expenses, missed asset costs, phantom parts adjustments, and month-end reconciliations that take a week to close. Integration doesn't just save time. It's the difference between an accurate cost-per-mile number and a plausible one.
What QuickBooks CMMS Integration Actually DoesNot sync-for-sync's-sake — a specific set of financial workflows automated
Vendors describe integration in generic terms: "seamless sync, real-time data." The specifics matter more than the slogans. Below is what a good QuickBooks CMMS integration replaces, per workflow.
Three of the four workflows above are where the biggest per-month savings hide. The bookkeeper's manual re-entry is the loudest. The capitalization error is the most expensive over three years.
Chart of Accounts Mapping — The Setup That Makes or Breaks ItGet this right once. Every future report gets easier.
The single most important setup step: mapping the CMMS maintenance categories to your QuickBooks chart of accounts. Get this right and every future report — cost per asset, cost per mile, R&M vs capital — is a two-click query. Get it wrong and you're back to Excel forever.
| CMMS Category | QuickBooks GL Sub-Account | Cost Type | Why It Matters |
|---|---|---|---|
| Preventive Maintenance | 5200 · R&M — PM | Expense | Isolates planned vs reactive maintenance ratio |
| Reactive Repair | 5210 · R&M — Repair | Expense | The reactive cost you're trying to reduce |
| DOT / Compliance | 5220 · R&M — Compliance | Expense | Regulatory line for audit & budget |
| Tires | 5230 · R&M — Tires | Expense | Highest single wear line; deserves its own bucket |
| Major Component Rebuild | 1520 · Fixed Assets — Improvements | Capital | Threshold-driven capitalization for depreciation |
| Labor (In-House) | 5300 · Shop Labor | Expense | Loaded rate applied per work order |
| Parts Inventory | 1310 · Parts Inventory | Asset → COGS | Balance sheet parked until consumed |
| Outside Vendor Repair | 5250 · R&M — Outside Vendor | Expense | Separates make-vs-buy analysis |
These are the standard buckets a well-configured fleet uses; your GL codes will differ. What doesn't differ: the discipline of one CMMS category to one GL sub-account, mapped once, defended over time. Book a demo — we'll walk your chart of accounts mapping on the call and show what a clean cost report looks like on your specific setup.
The Cost Visibility PayoffWhat CFOs actually gain when the two systems talk
Ask any fleet CFO what they wish they knew: cost-per-mile per asset, PM-vs-reactive ratio, and the truck that's costing more than it's earning. All three answers require the CMMS and QB data joined at the asset level. Without integration, that join is a monthly Excel project. With it, the join happens automatically and continuously.
Maintenance dollars from QB divided by miles from the CMMS. When both sides share the asset ID, this number becomes real. Trucks in the top decile of cost-per-mile are the rotation candidates.
The health metric of the whole maintenance program. Well-run fleets sit at 70–80% PM. Below 50% signals a program in reactive mode — and a cost line that keeps growing.
How much of a rebuild is an expense vs an asset improvement. Threshold-driven mapping (typically $2,500–$5,000) protects the depreciation schedule and the P&L both.
Acquisition + fuel + maintenance + downtime + resale. Only computable when the CMMS knows what the truck did and QB knows what the truck cost.
The finance team's reporting cadence typically moves from quarterly to monthly after integration — not because they have more time but because the reports run themselves. Book a demo to see the cost-per-mile report on your fleet size and how the joined data changes what's visible.
Asset Lifecycle Costs — The Long GameThe reason integration outperforms the alternatives over 3–5 years
Fleet asset lifecycle costs compound. A truck bought five years ago has accumulated maintenance history, parts consumption, labor hours, and downtime events — and every one of those is a data point about whether the truck earns its keep. Without integration, that history sits in two disconnected systems and never gets joined. With it, the question "which of our 2021 tractors should we rotate first?" is answered in a single query.
- Age-based cost curves. Maintenance cost by asset age reveals when a specific truck class crosses the buy-vs-repair threshold. Without joined data, this curve is impossible to draw.
- Component life prediction. Parts-consumption history against mileage predicts remaining life on major components — feeding capital-planning decisions two quarters out.
- Disposition timing. The interaction of maintenance-cost creep and resale-value decay identifies the peak-value window for each unit.
- Warranty recovery. Auto-tracked parts and labor against warranty windows recover money that manual processes routinely miss.
Implementation Workflow — Two Weeks, In OrderThe specific sequence that keeps the integration from collapsing on day 15
The failure mode of these integrations isn't technical — it's sequencing. Rushing the chart-of-accounts step to get a demo running by Friday is what causes the six-month cleanup project. Here's the order that works.
-
01Audit and freeze the QuickBooks chart of accounts
Any sub-accounts you're planning to add for maintenance categories — add them now. Any legacy accounts to be retired — retire them now. The CMMS map has to point at stable targets.
-
02Map CMMS categories to GL sub-accounts
Every maintenance category (PM, reactive, DOT, tires, outside vendor, labor, capital) maps to exactly one QuickBooks account. Ambiguity gets resolved before turning the sync on.
-
03Reconcile vendor master between systems
Same vendor, one record. Not "ABC Tire" in HVI and "ABC Tire Inc." in QB — that's what creates duplicate vendor errors on day 30. Merge, alias, or export-import to a single source.
-
04Set capitalization threshold and rules
Typically $2,500–$5,000 per component. Above the threshold, an item is a capital improvement to the fixed asset. Below, it's R&M expense. Rule lives in the integration, not in a manual review.
-
05Run parallel for one full close cycle
One month with both manual and automated posts. Reconcile at the end. Any variance is a mapping error — fix it before turning off the manual process.
-
06Turn off the manual re-entry
Not until parallel-run reconciles clean. Then and only then does the bookkeeper stop double-entering. Finance team runs their first automated month-end close on the following cycle.
Book a demo — we walk this implementation sequence with your controller in a 15-minute call and show what parallel-run reconciliation looks like on your specific setup.
Common Implementation ChallengesEvery pitfall you'll hit — and how to design around each one before it happens
"ABC Tire" and "ABC Tire Inc." create separate vendor records. Fix: merge before go-live; enforce vendor creation in one system only (usually QuickBooks) with a read-only mirror in the CMMS.
A work order with mixed PM and reactive parts posts to the wrong bucket. Fix: split at the line-item level, not the work-order level. Map parts and labor separately.
Rebuilds get expensed instead of capitalized (or vice-versa), distorting both P&L and depreciation. Fix: threshold-based automation with monthly review by controller.
API errors silently pile up, and finance discovers them at month-end. Fix: dashboard with sync status per stream, alert on any failure older than 24 hours.
A closed work order needs to change — what happens to the already-synced bill? Fix: journal-adjustment convention documented, and the CMMS never modifies a synced record without producing a QB reversal.
Every new maintenance category over 12 months = a new GL account. Ends in unreadable reports. Fix: freeze the mapping after go-live; new categories map to existing accounts unless a controller approves an exception.
Try HVI free and the pre-built connector ships with these guardrails on by default — duplicate detection, sync-status dashboard, threshold-based capitalization, and journal-adjustment rules configured.
Manual vs Integrated — The ComparisonEvery step in the maintenance-to-books flow, both ways
| Step | Manual (Two-System) | Integrated | Impact |
|---|---|---|---|
| Work order closes | Paper handoff to bookkeeper | Bill posts automatically to A/P | ∼30–40% admin time recovered |
| Parts consumed | Re-keyed into QB inventory | Real-time inventory + COGS post | Zero double-entry errors |
| Vendor bill received | Match paper PO to invoice by hand | Auto-matched to open work order | ~25% cost-accuracy lift |
| Cost-per-truck report | Excel join of two exports | Live report on joined dataset | Weekly cadence vs quarterly |
| Capital vs expense | Controller reviews each rebuild | Threshold-driven auto-classification | Depreciation basis stays clean |
| Month-end close | 4–6 days manual reconciliation | 1–2 days sanity check only | Finance team gets Fridays back |
| Audit trail | Paper cross-references | Every bill links to source work order | Audit-ready always |
| Warranty recovery | Ad-hoc lookups; often missed | Auto-flagged from parts + labor logs | Recovered dollars every quarter |
From a fleet CFO managing 240 assets across three yards
Before we integrated, month-end was five days of a full-time bookkeeper reconciling maintenance to accounting — and we still ended up with variance every quarter that took another two days to chase down. The variance wasn't malicious. It was volume. Nobody transcribes 600 work orders a month without errors.
The number that changed the ROI conversation for our CFO: we went from mapping 71% of maintenance dollars to a specific asset to 99% overnight. That's not efficiency — that's a completely different quality of data. The cost-per-mile numbers we'd been reporting for two years were off by 15% on the trucks that mattered.
Frequently asked questions
Can QuickBooks integrate with a CMMS?
Yes, both QuickBooks Online and QuickBooks Desktop integrate with modern fleet CMMS platforms via native connectors and API-based sync. A properly configured integration moves six core data streams automatically: completed work orders become bills or A/P entries, parts consumed adjust inventory and post COGS, vendor records sync bi-directionally, labor hours flow to job cost or payroll, capital component costs update the fixed-asset register, and CMMS maintenance categories map to QuickBooks GL sub-accounts. HVI's native QuickBooks connector supports both Online and Desktop editions and is part of the 30+ pre-built integrations that also include SAP, Sage, Oracle, and Viewpoint. Setup is typically 2 weeks including chart-of-accounts mapping and a parallel-run reconciliation cycle before manual entry is turned off.
How do you track fleet maintenance costs in QuickBooks?
Fleet maintenance costs in QuickBooks are tracked at three levels: GL sub-account (by category), class or location (by yard or cost center), and customer/job (by individual asset). The best practice is a dedicated set of R&M sub-accounts — PM, reactive repair, DOT compliance, tires, outside vendor, in-house labor — each mapped one-to-one with the equivalent CMMS category. Assets are represented as customer records or job codes, letting every cost line post to a specific truck or unit. Without a CMMS integration, this requires manual coding on every bill; with integration, the correct GL sub-account and asset ID are populated automatically from the work order. That's what enables cost-per-mile and cost-per-asset reports to run continuously instead of quarterly.
What are the benefits of CMMS accounting integration?
Four categories of benefit, each measurable. Administrative time recovery: manual maintenance-accounting entry typically consumes 30–40% of a bookkeeper's week; integration collapses that to near zero. Cost accuracy: industry data shows integrated fleets improve cost accuracy by up to 25% because they eliminate transcription errors, mis-categorization, and missed line items. Reporting cadence: cost-per-mile, PM-vs-reactive ratio, and cost-per-asset reports move from quarterly Excel projects to continuous live queries. And audit readiness: every posted bill links to a source work order with photos and signatures, so the audit trail is prebuilt and end-to-end rather than reconstructed after the fact. Over 3–5 years, the compounding benefit is capital planning that runs on real data instead of estimates.
How are work orders synced with QuickBooks?
When a work order closes in the CMMS, an API call posts the transaction to QuickBooks in real time. The bill or A/P entry inherits the vendor, the asset (as a customer/job or class), the GL sub-accounts based on the CMMS category mapping, and the line-item split between labor, parts, and outside vendor. Photos, signatures, and inspection reports attached to the work order become supporting documentation linked from the QuickBooks record. Amendments and reversals follow a documented convention — typically, the CMMS never modifies a synced record without producing a matching QB journal adjustment, protecting the audit trail. The full round-trip typically completes in under 5 seconds per work order and does not require the finance team to touch anything unless a mapping exception fires.
Does QuickBooks support fleet maintenance out of the box?
QuickBooks is a general accounting platform, not a fleet management system. It has the accounts, the vendor records, the inventory module, and the reporting engine needed to house fleet financial data — but it doesn't manage work orders, PM schedules, DVIRs, parts requisitions, or DOT compliance records. That's what the CMMS does. The integration is what makes them work together: the CMMS handles the maintenance workflow and the operational data; QuickBooks handles the books of record; and the two systems sync at the data layer so no one is retyping anything. Fleets that try to run maintenance directly in QuickBooks end up building elaborate custom fields and class hierarchies that break within a year. Fleets that integrate a CMMS get the operational depth without compromising the accounting integrity.
Related HVI guides
Turn month-end close from a week into an afternoon
HVI's native QuickBooks connector moves work orders, parts, vendors, labor, and capital costs into the right GL accounts automatically. Chart-of-accounts mapping is a one-time setup with the HVI finance team. Parallel-run for one close cycle. Then manual re-entry is gone.
QuickBooks Online + Desktop · Live in under two weeks · No CFO Excel required