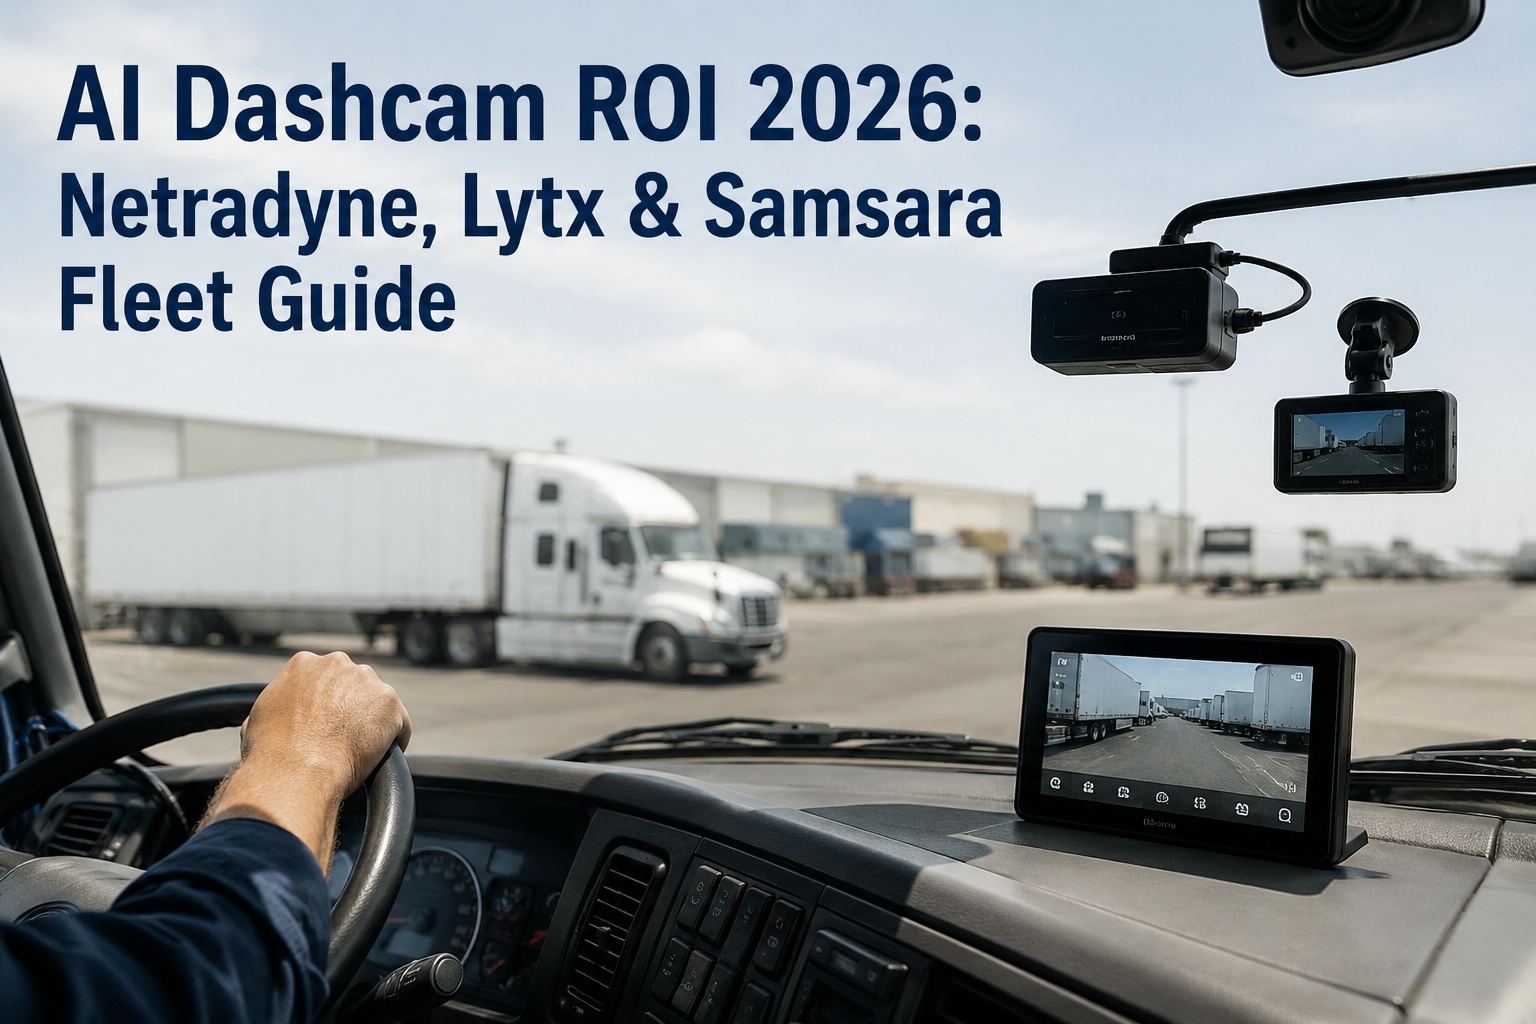
AI dashcam ROI depends on your fleet's specific claims profile, not vendor-marketed percentages. Netradyne, Lytx, and Samsara all publish 4-6 month payback claims. Actual math produces payback ranging from 3 months on high-risk fleets to negative ROI on safe fleets with clean records. This guide walks the 5-component ROI model finance teams will approve, benchmarks Netradyne / Lytx / Samsara on the components each delivers strongest, and shows why one fleet's break-even is another fleet's $200K+ win — book a demo to measure fleet safety and incident ROI in HVI.
AI Dashcam ROI — The 5 Components That Actually Determine Payback
Same $480/truck/year subscription. Wildly different ROI depending on which fleet profile is running it. Here is the honest math.
5 ROI components per truck per year
Numbers use published fleet case study medians and industry insurance data. Actual ROI on any specific fleet requires modelling against that fleet's claims frequency, severity, and current premium structure — not vendor-published averages.
The rest of this page walks how to build the ROI model for your specific fleet, benchmarks Netradyne / Lytx / Samsara head-to-head on the ROI components each delivers strongest, explains where vendor-quoted percentages come apart under CFO scrutiny, and shows how to structure the safety records and audit trail that convert projected ROI into documented savings. Book a 30-minute demo to see per-driver safety records and corrective-action tracking in HVI.
Netradyne vs Lytx vs Samsara — head-to-head on the ROI components that matter
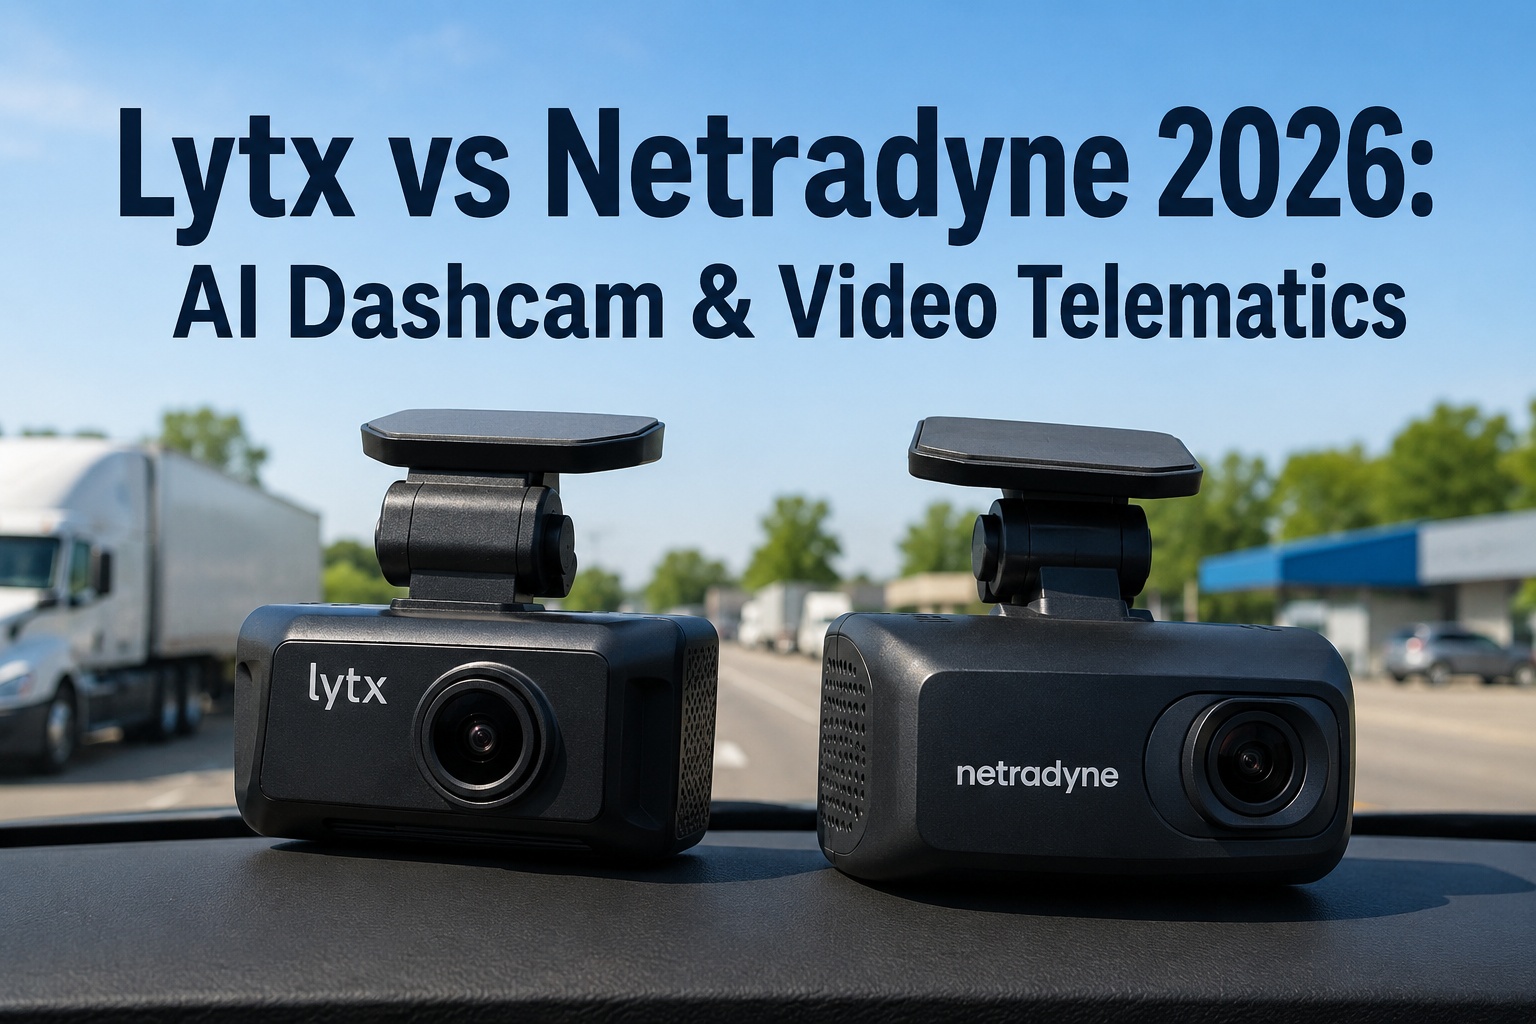
All three dominate the AI dashcam market and all three produce measurable ROI on the right fleet. The differences show up when you match a specific vendor's strongest capability against a specific fleet's biggest ROI opportunity. Netradyne's positive-reinforcement model wins on driver acceptance and coaching-time savings. Lytx's analyst-reviewed events win on insurance documentation and litigation defense. Samsara's unified platform wins on operational consolidation and total-fleet visibility.
| Dimension | Netradyne Driver·i | Lytx DriveCam | Samsara AI Dash Cam |
|---|---|---|---|
| Pricing (per veh / mo) | $35-$55 custom quote | $40+ custom quote | $27-$33 published |
| Contract term | 1-3 years typical | Long-term preferred (3+ years) | 1-3 years typical |
| Event review model | On-device AI, real-time in-cab audio coaching | Professional analyst review before coaching | On-device AI, real-time in-cab audio + dashboard alerts |
| Coaching approach | Positive reinforcement (GreenZone score + DriverStars) | Event-focused coaching workflow with analyst notes | Configurable scoring + real-time nudges |
| Data scale | 25B+ miles analyzed | Extensive historical safety database | 220B+ customer miles |
| Platform scope | Safety camera only; integrates with telematics | Safety camera + integrations (Geotab, others) | Full unified platform (safety, ELD, tracking, fuel) |
| Strongest ROI component | Coaching + driver acceptance | Insurance premium + claims defense | Operational consolidation + platform ROI |
| Best-fit fleet | Driver retention priority + acceptance-sensitive | Insurance-heavy exposure + litigation defense | Single-vendor consolidation strategy |
The vendor choice matters less than the fit-to-profile match. A Netradyne deployment on a fleet with no coaching workflow wastes the positive-reinforcement advantage. A Lytx deployment on a fleet without analyst-supportable insurance exposure wastes the review model. A Samsara deployment on a fleet already committed to another telematics platform wastes the consolidation value. Match the vendor's strongest capability to the fleet's largest ROI opportunity and payback follows. Match them wrong and even best-in-class hardware produces marginal returns. Book a demo to see safety-record tracking that works alongside any dashcam vendor in HVI.
Where vendor-quoted ROI comes apart under CFO scrutiny
Every major vendor publishes fleet case studies showing 4-6 month payback and multi-hundred-percent first-year ROI. The numbers are real for the specific fleet described in the case study. They routinely fail to hold on a different fleet with different claims profile, different insurance structure, and different coaching maturity. Four assumption gaps break vendor-quoted ROI when applied to fleets that don't match the case study profile.
Insurance discount assumption
Vendor claims of 15-20% premium reduction assume the insurer already offers a documented-safety-program discount and the fleet qualifies. Some insurers offer 0%, some offer 5%, some require 24 months of clean data before the discount applies. Verify with the actual insurer before modelling.
Collision reduction percentage
20-30% preventable-collision reduction is the industry median. Safe fleets with already-low collision frequency have less headroom and produce smaller absolute savings. High-risk fleets with elevated frequency produce dramatically larger savings than the median. Match the assumption to fleet actuals, not marketing.
Exoneration expected value
$5K-$25K per exonerated claim only materialises if the fleet actually faces that many claims and the footage actually clears them. Fleets with under 1 claim per truck per year rarely see the exoneration benefit as a significant ROI contributor. Fleets with 3+ claims per truck per year sometimes see it as the largest single line item.
Coaching workflow assumption
Vendor ROI models assume the fleet has a functioning coaching program that will act on captured events. Fleets that install cameras without a coaching workflow capture footage nobody reviews and produce neither behavior change nor documented safety improvement. Coaching capacity is the hidden dependency.
A defensible ROI model for a specific fleet uses that fleet's actual claims frequency, actual insurance discount structure, actual coaching capacity, and actual exposure profile — not vendor case study medians. On some fleets the honest model produces $3,000-$6,500 per truck per year of net value, easily supporting the CFO business case. On other fleets the honest model produces marginal ROI, which is important information the vendor spec sheet won't provide. Book a demo to see how HVI captures the incident and safety-program data needed to model and prove ROI on your specific fleet.
How to build the ROI model your CFO will actually approve
The model that survives CFO scrutiny uses fleet-specific inputs rather than vendor-published averages. It shows sensitivity to assumption changes rather than a single point estimate. It attributes each ROI component to a specific measurable outcome. And it commits to quarterly re-measurement rather than a one-time projection. Four inputs and one output structure produce a defensible model.
Fleet claims baseline
- Preventable collisions per 100K miles (3-year avg)
- Average claim severity per incident
- Not-at-fault claim frequency
- Current insurance premium per truck
Insurance discount confirmation
- Written confirmation from current insurer
- Discount percentage available
- Qualification requirements documented
- Time-to-qualify for full discount
Coaching capacity assessment
- Safety manager hours available per week
- Coaching cadence sustainable (weekly? bi-weekly?)
- Driver population that can be coached in cycle
- Coaching workflow tools in place
Sensitivity output
- Base case, upside case, downside case scenarios
- Net ROI per truck per year in each case
- Break-even sensitivity to each input
- Quarterly re-measurement commitment
The output should tell the CFO: on the base-case assumptions this program produces $X per truck per year of net value, on the downside case it produces $Y, on the upside case it produces $Z, and here is the specific insurance conversation, coaching workflow, and quarterly measurement we're committing to in order to hit the base case or better. That framing survives CFO review because it acknowledges uncertainty, commits to accountability, and separates projection from result. Vendor-quoted single-point ROI does not survive the same review. Start a free HVI trial to build the safety-record baseline needed for a defensible model.
A risk manager on modelling actual ROI on 180 tractors with three different vendors
We're a 180-tractor multi-region carrier, mixed dry van and reefer, moderate claims profile (2.4 preventables per 100K miles baseline). Ran a competitive dashcam evaluation Q1 2024 covering Netradyne, Lytx, and Samsara on 30-tractor pilots each — 90-tractor total pilot, 90 days per vendor. Objective was actual per-vendor ROI on our specific claims profile, not vendor-marketed averages.
Measured results at pilot close: Netradyne pilot reduced preventable events 34%, highest driver acceptance (72% opt-in survey vs 51% Samsara, 48% Lytx), lowest coaching-time overhead. Lytx pilot reduced preventable events 29%, produced the strongest incident-review documentation package for our commercial auto insurer, secured us a 12% premium reduction commitment at next renewal. Samsara pilot reduced preventable events 26%, but we were already running Samsara ELD so the platform-consolidation value added roughly $60/truck/year of operational-cost savings.
Decision: rolled Lytx to the full 180 fleet. The 12% insurance premium reduction on our $1.8M annual premium was $216K/year — largest single ROI component by far. Netradyne would have won on driver acceptance and coaching but the insurance number moved the model decisively. Actual 2025 result: 31% preventable reduction (below Netradyne pilot but above vendor-marketed 20% average), $198K premium reduction realized at renewal, 4 exonerated claims worth ~$62K, $412K total measurable ROI against $187K program cost. 2.2x first-year ROI on actual measured outcomes vs vendor-projected 4-6x. Still strongly positive; just not the number vendors publish.
Frequently asked questions
What is the typical AI dashcam ROI for a commercial fleet?
AI dashcam ROI varies dramatically by fleet profile rather than converging on a single industry number. Safe fleets (under 1 preventable per 100K miles, clean claims history) typically see net ROI ranging from break-even to marginal loss on a per-truck basis; the program is mostly nuclear-verdict insurance for these fleets. Typical fleets (2-3 preventables per 100K miles, mixed claims history) commonly see net ROI of $800-$1,600 per truck per year with 4-7 month payback, matching vendor-marketed claims. High-risk fleets (4+ preventables per 100K miles, elevated claims severity) frequently see net ROI of $3,000-$6,500 per truck per year with 2-3 month payback and 400-1,000% first-year returns. Program costs run $480-$780 per truck per year across hardware, subscription, install, and coaching workflow overhead. ROI components stack from five sources: insurance premium reduction (5-20% at renewal on documented programs, $300-$1,200/truck/yr), preventable collision reduction (20-30% fewer incidents, $400-$2,500/truck/yr avoided cost), not-at-fault exoneration ($5K-$25K per exonerated claim, $200-$1,500/truck/yr expected value), nuclear verdict avoidance ($1M-$100M+ single-event exposure, unquantifiable but board-level), and driver coaching time savings ($200-$400/truck/yr manager time). Any single-fleet ROI projection should use that fleet's actual claims frequency, actual insurance discount structure, and actual coaching capacity rather than vendor case study medians.
Which is better: Netradyne, Lytx, or Samsara?
All three dominate the AI dashcam market and all three produce measurable ROI on the right fleet. The right choice depends on which vendor's strongest capability matches the fleet's largest ROI opportunity. Netradyne Driver·i wins on driver acceptance and coaching-time efficiency; its positive-reinforcement model (GreenZone Score, DriverStars) drives 15% collision reduction correlations validated against 50-point score improvements, and produces higher opt-in acceptance rates on driver-facing camera deployments. Best fit: fleets prioritising driver retention and acceptance-sensitive rollouts. Lytx DriveCam wins on insurance premium documentation and claims defense; its professional-analyst-reviewed event model produces the strongest incident review packages for commercial auto insurers and litigation counsel. Best fit: fleets with heavy insurance exposure, elevated claims profile, or active litigation defense priorities. Samsara AI Dash Cam wins on operational consolidation; its unified platform brings safety, ELD, tracking, fuel monitoring, and dispatch into one dashboard. Best fit: fleets pursuing single-vendor telematics consolidation strategy. Pricing: Samsara publishes $27-$33 per vehicle per month; Lytx typically $40+ via custom quote; Netradyne quoted at $35-$55 per vehicle per month. Contract terms: Samsara and Netradyne 1-3 years typical; Lytx prefers 3+ year commitments. Matching the vendor's strongest capability to the fleet's largest ROI opportunity produces the best outcome; mismatched deployments waste capability the fleet paid for.
How much does an AI dashcam actually cost?
2026 AI dashcam pricing runs $27-$60 per vehicle per month for premium tier vendors (Samsara $27-$33, Netradyne $35-$55, Lytx $40+, Motive similar to Netradyne range), typically as bundled hardware plus subscription with installation included in the qualifying contract. Budget-tier alternatives (SmartWitness, Vantrue, LinxCam) start at $15-$25 per vehicle per month but generally lack the AI event detection, real-time coaching, and analyst-review layers that drive premium-tier ROI. Total program cost across hardware, subscription, install, and coaching workflow overhead typically runs $480-$780 per vehicle per year. Contract terms range from month-to-month (GPS Insight, some smaller vendors) through 1-3 years (Samsara, Netradyne typical) to 3+ years (Lytx preferred). Longer contract commitments often produce 10-25% pricing improvements. Hidden costs to model include coaching workflow tools (some vendors bundle, some don't), cellular data if not included, storage overages for extended retention beyond default 30-90 days, and integration development if the dashcam needs to talk to existing telematics or safety systems. A comprehensive ROI model uses total program cost rather than headline monthly subscription. On a 100-truck fleet the annual program cost commonly reaches $48,000-$78,000 all-in.
Do dashcams actually reduce insurance premiums?
Sometimes, and the size of the reduction depends on the insurer, the documented safety program, and the fleet's baseline claims profile. Industry-published claims of 15-20% premium reductions represent the best-case outcomes, not the median. Some commercial auto insurers offer 5-15% discounts for documented AI dashcam programs with structured coaching workflow. Some insurers offer no discount but factor the program into general safety underwriting. Some insurers require 12-24 months of documented safety improvement before the discount applies. A few insurers specifically request certain vendors (Lytx and Netradyne appear most frequently on carrier preferred-vendor lists due to their analyst-review or GreenZone score models). Before modelling insurance premium reduction as an ROI component, obtain written confirmation from the specific commercial auto insurer covering the fleet: what discount is available, what documentation qualifies, what timeline applies, and what happens to the discount if the fleet switches vendors. Fleets that model 15-20% premium reduction without insurer confirmation routinely miss the target by half or more; fleets that pre-confirm with the insurer commonly hit or exceed the modelled reduction. The insurance discount is the single largest ROI component on typical fleets, so getting the assumption right is disproportionately valuable.
How long before an AI dashcam program pays back?
Payback timing varies by fleet profile. Vendor-marketed 4-6 month payback is realistic for typical fleets (2-3 preventables per 100K miles, moderate claims history, functioning coaching workflow, insurer-confirmed premium discount). High-risk fleets with elevated claims frequency and severity commonly hit payback in 2-3 months as preventable-collision reduction plus a single exonerated claim can offset a full year of program cost within the first quarter. Safe fleets with low baseline claims frequency may reach 12-24 month payback or, on the safest fleets, marginal ROI where the program primarily provides nuclear-verdict insurance rather than measurable financial return. The two most common failure modes that extend payback beyond projections are missing insurance discount confirmation (fleet assumed 15% premium reduction; insurer offers 3-5%) and inadequate coaching workflow (fleet captures events but has no capacity to review and act on them, producing minimal behavior change and no documented improvement for insurer review). Structuring the deployment with insurer confirmation before hardware install, coaching workflow before event capture, and quarterly ROI re-measurement produces the fastest realized payback. Structuring without those disciplines commonly extends payback well beyond vendor-projected timelines and sometimes reverses program ROI within 12-18 months.
Prove the ROI. Every quarter. With records the CFO and insurer both trust.
HVI captures per-driver safety events, coaching sessions, corrective actions, and incident outcomes from any AI dashcam vendor. Quarterly reports show what the safety program is producing in dollars, documented for insurance renewal and litigation defense. The vendor supplies the camera; HVI supplies the system of record that converts vendor-projected ROI into documented savings. Live in under two weeks. No hardware. No credit card.
Trusted by safety & risk management programs across USA, Canada, UK, EU & Australia · Ready on day one