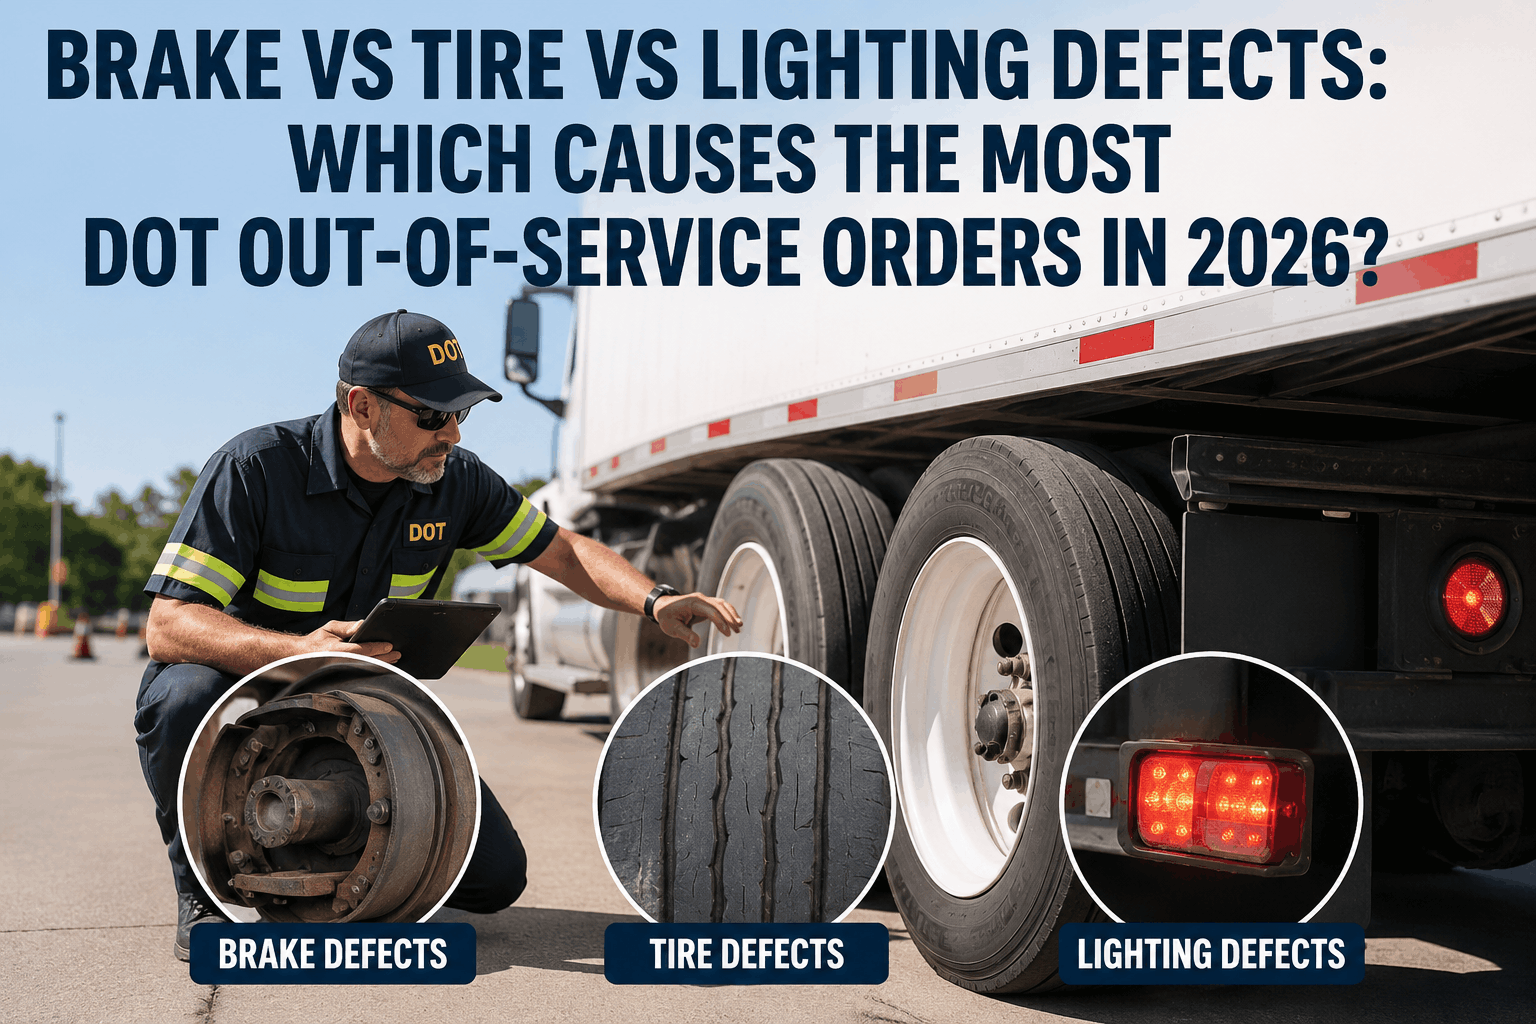
Brake vs Tire vs Lighting Defects: Which Causes the Most DOT Out-of-Service Orders in 2026?

By Dexter Watts on May 29, 2026

brake-tire-lighting-defects-oos

Every year, FMCSA and CVSA release the same headline finding with mathematical consistency: brakes, tires, and lighting defects together generate over 75% of all commercial vehicle out-of-service orders in North America. The three categories don't tie — there's a clear, durable ranking. Brake system defects lead by a wide margin (24.4% of vehicle OOS in 2025, plus an additional 16.7% for "20% defective brakes" — 41.1% combined). Tires sit second at 21.4%. Lighting violations come third at 14%. For fleet and safety managers, the operational question isn't whether to address all three — it's where to invest first, because the prevention strategies differ sharply: brakes require under-vehicle inspection that walk-arounds miss, tires need pressure-gauge discipline at pre-trip, and lights are the most preventable failure category on the entire OOS list. This data-driven comparison breaks down each category by 2025–2026 violation frequency, repair cost, downtime impact, and prevention strategy — with the 2026 Roadcheck escalation that pushed the overall OOS rate to nearly 33%. For fleet managers building a defect-prevention program that targets the three categories that drive 75% of risk, Start your free HVI trial to put guided pre-trip workflows and defect routing on every driver, or book a demo to see how HVI surfaces brake, tire, and lighting issues before they become OOS orders.

2025–2026 FMCSA & CVSA Roadcheck Data
Three categories. One clear hierarchy. 75%+ of every OOS order issued in 2025.
#1
41.1%
Brake defects
Combined: 24.4% + 20% defective
#2
21.4%
Tire defects
2,899 OOS violations in 2025
#3
14%
Lighting defects
Most preventable on the list
2025 CVSA Roadcheck: 56,178 inspections · 22.6% overall vehicle OOS rate · 2026 Roadcheck final OOS rate: ~32.8%

The data verdict — brakes lead, and the gap is widening

This isn't a close race. Across every recent Roadcheck cycle — 2023, 2024, 2025 — brake system defects have generated more OOS orders than tires and lights combined. The pattern holds regardless of which category CVSA names as the year's "vehicle focus" — brakes don't need extra attention to keep leading the table.

41.1%
Brakes (combined)
21.4%
Tires
14%
Lights
11%
Cargo
12.5%
All other
2025 CVSA Roadcheck vehicle OOS distribution. Brake total includes both "Brake System" (24.4%) and "20% Defective Brakes" (16.7%) categories.
The five-year pattern: Brakes + tires + lights have produced over 70% of vehicle OOS orders every single year since 2020. CVSA's 2026 named focus was cargo securement and ELD tampering — but actual OOS data still showed brakes, tires, and lights generating the highest volume. The categories ranked here aren't a 2025 anomaly; they're the structural shape of commercial vehicle failure.

Brake defects — the #1 category, by a wide margin

#1
Brake system defects
2025 OOS share41.1% combined
Violations issued5,561 (brake + 20% defective)
Inspection accessUnder-vehicle required
Avg repair cost$800–$4,200

What gets you OOS: Slack adjusters out of spec, audible air leaks at chambers, brake lining below 1/4", cracked or scored drums, defective ABS, brake pushrod travel exceeding limits. The 20% defective brakes rule places a vehicle OOS when at least one-fifth of the braking system has a defect — even if each individual defect is minor.

Top brake violations
  • Slack adjuster adjustment out of limits
  • Audible air leaks at chambers/lines
  • Brake lining below minimum thickness
  • Inoperative brakes on any wheel
  • Brake pushrod travel exceeding spec
  • Defective ABS warning system
Why brakes dominate the OOS table
  • Most catchable issues require under-vehicle access
  • Level II walk-arounds miss most brake defects
  • Slack adjusters drift continuously with use
  • Heat cycling stresses drums and pads
  • Air system leaks build slowly between PMs
  • No driver feedback until issue is severe
Prevention: Daily pre-trip air leak check at 90+ PSI with parking brake released; quarterly slack-adjuster travel measurement; annual brake inspection per 49 CFR 396 Appendix A. Digital DVIRs that require actual pushrod-stroke readings catch issues paper systems miss.

Tire defects — the #2 category, and the most-cited single violation

#2
Tire defects
2025 OOS share21.4%
Violations issued2,899 OOS violations
Inspection accessWalk-around catchable
Avg repair cost$300–$1,800

What gets you OOS: Steer tires below 4/32" tread depth, drive tires below 2/32", sidewall damage exposing cord ply, inflation below 50% of max PSI, flat tires, improperly repaired tires, tires not rated for the load or highway use. The single FMCSA violation "Tires – All others, leaking or inflation less than 50%" was the 4th most-cited violation nationwide in 2025.

Top tire violations
  • Steer tire tread below 4/32" (auto-OOS)
  • Drive tire tread below 2/32" (auto-OOS)
  • Inflation below 50% of max PSI
  • Sidewall cuts exposing cord/ply
  • Visible bulges or improper repairs
  • Load-rating mismatch with cargo weight
Why tires are #2, not #1
  • Tread depth and sidewall damage are visible
  • Drivers can catch most issues at pre-trip
  • Pressure gauges make verification simple
  • Multiple driver/dispatch opportunities to catch
  • Slow leaks usually show on walk-around
  • Tire failures rarely surprise an alert driver
Prevention: Tread gauge on every tire, every shift — not just visual check. Pressure-gauge soft-looking tires. Walk all four sidewalls. Document tread depth as actual numeric reading, not "OK" — required-field digital inspections catch this.

Lighting defects — the #3 category and the most preventable failure on the list

#3
Lighting defects
2025 OOS share14%
Avg repair cost$25–$200
Inspection accessWalk-around catchable
PreventabilityHighest of the three

What gets you OOS: Inoperative required lamps — particularly brake lights, turn signals, tail lights, clearance lights, marker lights, headlights. The fix is almost always a $5 bulb. The catch rate at roadside is high because lights are visible from outside the cab — and the prevention rate is high because drivers can spot every required lamp in a 60-second walk-around.

Top lighting violations
  • Inoperative brake lights
  • Inoperative turn signal lamps
  • Missing or non-functional clearance lights
  • Burned-out marker lights
  • Inoperative or improperly aimed headlights
  • Trailer tail/identification light failures
Why lights are the easy win
  • Cheapest repair on the OOS list ($5 bulbs)
  • No diagnostic equipment needed to detect
  • Visible from outside the vehicle, instantly
  • Driver pre-trip catches 95%+ if done
  • Fastest fix in the yard (under 5 minutes)
  • Highest ROI on inspection discipline
Prevention: Lights on, hazards on, walk the full perimeter every pre-trip. Have a helper press the brake pedal while you check brake lights. Replace marginal bulbs before they fail — a dim bulb on the way out is still a citation. Lights are the most preventable category on the entire OOS list.

Three-way comparison matrix — at a glance

Side-by-side-by-side: how each category compares on the dimensions that matter for fleet planning. The pattern is sharp — brakes are expensive and hard to catch, lights are cheap and easy to catch, tires sit between them on both axes.

#1
Brakes
OOS share41.1%
Repair cost$800–$4,200
Downtime1–3 days
Walk-around catchPartial
Under-vehicle accessRequired
Driver-detectableLow
PM frequencyQuarterly + annual
#2
Tires
OOS share21.4%
Repair cost$300–$1,800
Downtime2–6 hours
Walk-around catchYes
Under-vehicle accessNot required
Driver-detectableMedium
PM frequencyDaily check
#3
Lights
OOS share14%
Repair cost$25–$200
Downtime10–60 min
Walk-around catchYes (easy)
Under-vehicle accessNot required
Driver-detectableHigh
PM frequencyDaily check

The 2026 escalation — OOS rate nearly doubled in May

The 2025 CVSA Roadcheck recorded an 18.1% vehicle OOS rate. The 2026 event, run May 12–14, saw a dramatic escalation: the final-week OOS rate settled at approximately 32.8% — nearly double the prior year. Day 2 alone added 4,826 inspections, 8,373 violations, and 1,559 OOS orders. The escalation matters for fleet managers because it suggests enforcement is tightening, not loosening — and brake/tire/lighting defects are still driving the volume.

2025 Roadcheck
18.1%
Vehicle OOS rate
56,178 inspections · brakes/tires/lights drove 75%+ of failures
2026 Roadcheck
32.8%
Vehicle OOS rate (final week)
Day 2 alone: 1,559 OOS orders · same 3 categories driving volume
What the escalation tells fleet managers: The categories aren't changing — brakes, tires, and lights still dominate. What's changing is enforcement intensity. With OOS rates approaching 1-in-3 trucks during focused enforcement weeks, prevention discipline matters more than it did 12 months ago. Fleets running paper DVIRs and relying on driver memory are entering a noticeably higher-risk environment in 2026.

Penalty exposure — what each OOS event actually costs

Beyond the immediate repair, an OOS order triggers a cascade: roadside downtime, lost load revenue, potential CSA score damage, and direct civil penalties under the FMCSA 2026 schedule. Penalties compound per occurrence — a fleet with a pattern is looking at far more than a single fine.

Cost element
2026 amount
When it applies
Standard Part 396 violation
Up to $19,246
Per violation, non-recordkeeping
Operating with known OOS defects
Up to $19,277
Carrier knew defect existed
Operating under OOS order
Up to $23,048
Continued operation after OOS
Average per-OOS event cost
~$4,200
Includes tow, repair, downtime, lost revenue
CSA score impact
24-month weighting
2026 BASIC split makes Vehicle Maint more visible

The prevention strategy — different category, different mechanism

Because the three categories have such different access requirements and driver-detection rates, the prevention strategy for each is fundamentally different. Treating them as a single "do better pre-trips" project misses what actually works for each.

For brakes
PM-driven, not driver-driven

Brake defects largely escape walk-around inspections. The defense is rigorous scheduled PM: quarterly slack-adjuster checks, annual 49 CFR 396 Appendix A inspection, air leak-down tests at PMs. Pre-trip air leak audible check catches some issues but not all.

Software fix: PM scheduling on actual engine hours, never on memory.
For tires
Driver-discipline + tools

Tire defects are catchable, but only if drivers actually measure rather than eyeball. Tread gauge on every tire, every shift. Pressure gauge on any soft-looking tire. Required-field digital inspections force actual measurement instead of "OK" responses.

Software fix: numeric-required tire fields with photo capture on flags.
For lights
Pure walk-around discipline

The most preventable category in the OOS data. Lights on, hazards on, full perimeter walk. The cost of prevention is 60 seconds of attention. Lights only get cited when drivers don't actually walk the truck — software that requires a photo of every flagged light forces the walk-around.

Software fix: required photo evidence on each light category.

How HVI eliminates the categories driving 75% of OOS orders

Brakes, tires, and lights each fail for a different reason — but a single inspection platform can address all three by enforcing the specific discipline each category requires. HVI's eDVIR workflow maps directly to the three prevention mechanisms above.

A
PM scheduling on engine hours

Brake PMs fire automatically on actual machine hours — quarterly slack-adjuster checks, annual 49 CFR 396 Appendix A inspection, leak-down tests. Never missed because of memory.

B
Required-field tire measurements

Drivers can't submit a DVIR with "OK" on tires — actual tread depth and PSI readings are required, photo-verified. The category that should be catchable becomes the category that always is.

C
Lights-on photo requirement

Every lighting category requires a photo on the inspection — confirming the driver actually walked the perimeter with lights energized. Lights are the cheapest fix and the easiest to prevent — HVI eliminates the rest of the gap.

D
Defect-to-work-order routing

Any "Fail" on brakes, tires, or lights auto-creates a work order with photo and vehicle ID. The truck cannot dispatch with the defect open — eliminating the "dispatched with known OOS defect" violation ($19,277 max).

E
CSA-mapped templates

HVI's inspection templates pre-map to the 2026 CSA "Driver Observed" BASIC — capturing exactly the evidence that protects driver and carrier scores from defects in these three categories.

F
12-month audit archive

Every inspection, work order, repair certification indexed by VIN and date. When the auditor arrives, brake, tire, and lighting compliance is documented and exportable in under a minute.

Fleets that systematically eliminate brake, tire, and lighting defects from pre-trip cut their OOS exposure by 75% with no new equipment and no extra labor. Start your free HVI trial to put guided inspections on every driver, or schedule a 30-minute walkthrough to see how HVI maps to your current PM program.

Frequently asked questions

QWhat causes the most DOT out-of-service orders?
Brake system defects are the #1 cause of vehicle out-of-service orders by a wide margin. In the 2025 CVSA International Roadcheck, brake system violations alone generated 24.4% of vehicle OOS orders (3,304 violations), with an additional 16.7% (2,257 violations) from the "20% defective brakes" category. Combined, brake-related issues accounted for 41.1% of all vehicle OOS findings. This pattern has held in every recent Roadcheck cycle regardless of which category CVSA names as the year's focus.
QHow do brake, tire, and lighting violations rank in 2025–2026?
Brakes lead (41.1% combined), tires sit second (21.4%, 2,899 violations), lighting is third (14%). Together they generated over 75% of all vehicle OOS orders in 2025. The 2026 Roadcheck (May 12–14) saw the overall OOS rate climb to ~32.8% — nearly double 2025's 18.1% — with the same three categories still driving the highest volume of actual OOS orders despite CVSA naming cargo securement and ELD tampering as the year's focus areas. Start your free HVI trial to prevent the three categories driving the majority of fleet OOS exposure.
QWhy do brake defects cause more OOS orders than tires or lights?
Three reasons. First, most brake defects require under-vehicle inspection to detect — Level II walk-arounds miss what Level I under-vehicle inspections catch. Second, brake components drift continuously between PMs — slack adjusters move out of spec with use, air systems develop slow leaks, linings wear unevenly. Third, drivers get little direct feedback until a brake issue is severe, so honor-system pre-trips miss many defects entirely. The combination of low driver-detectability and high inspection thoroughness makes brakes structurally more likely to generate OOS orders than the other categories.
QWhat's the average cost of a brake, tire, or lighting OOS order?
Brake OOS events average $800–$4,200 in direct repair cost, plus 1–3 days of downtime. Tire OOS events run $300–$1,800 in repair plus 2–6 hours typical downtime. Lighting OOS events are the cheapest fix on the list — $25–$200 for bulbs and labor, often resolved in under an hour. Across all three categories, the FMCSA 2026 penalty schedule allows up to $19,246 per violation, $19,277 for operating with known OOS defects, and $23,048 for operating under an OOS order. The average all-in cost per OOS event (including downtime and lost revenue) is roughly $4,200. Book a demo to see how HVI tracks per-VIN OOS exposure.
QWhy are lighting defects so preventable but still account for 14% of OOS?
Lighting violations are the most preventable category on the entire OOS list — every required lamp is visible from outside the vehicle, the fix is almost always a $5 bulb, and a 60-second walk-around catches the vast majority. They still account for 14% of OOS orders because many drivers don't actually walk the perimeter at pre-trip — they sit in the cab, check every box "OK," and start the clock. The lighting category is essentially a measure of pre-trip discipline. Digital inspections with required photo evidence on each light category force the walk-around to actually happen, eliminating most of the citations.
QHow can fleets reduce brake, tire, and lighting OOS exposure?
Each category needs a different mechanism. Brakes need rigorous scheduled PM — quarterly slack-adjuster checks, annual 49 CFR 396 Appendix A inspection, air leak-down tests at every PM. Tires need driver-discipline plus tools — tread gauge and pressure gauge on every shift, required-field digital inspections that won't accept "OK" without actual readings. Lights need pure walk-around discipline enforced by required photo evidence on each lamp category. All three benefit from defect-to-work-order routing that prevents dispatch with a known defect — the violation that costs up to $19,277 per occurrence. Start your free HVI trial to deploy all three mechanisms on one platform.
QHow does the 2026 CSA SMS overhaul affect brake, tire, and lighting violations?
FMCSA's 2026 SMS update split the Vehicle Maintenance BASIC into two scored categories — including a new "Driver Observed" sub-category for defects a driver should have caught at pre-trip. Lighting, tire pressure, and tread depth all sit in the Driver Observed category, where they now score separately and are visible to insurance carriers and shippers. Brake defects requiring under-vehicle inspection generally remain in the standard Vehicle Maintenance category. The split makes it more visible when a fleet has a driver-level pre-trip discipline problem versus a deeper mechanical issue — and the recent six months of violations are weighted heavier in the score.

Three categories. 75% of OOS exposure. One inspection platform that addresses all three with the discipline each requires.

HVI enforces PM scheduling for brake systems, required-field measurements for tires, and photo-verified walk-arounds for lighting — eliminating the three categories that drive the majority of fleet OOS orders in 2026.

No credit card required · CSA-mapped inspection templates · 12-month audit archive from day one


Share This Story, Choose Your Platform!

Start Free Trial Book a Demo