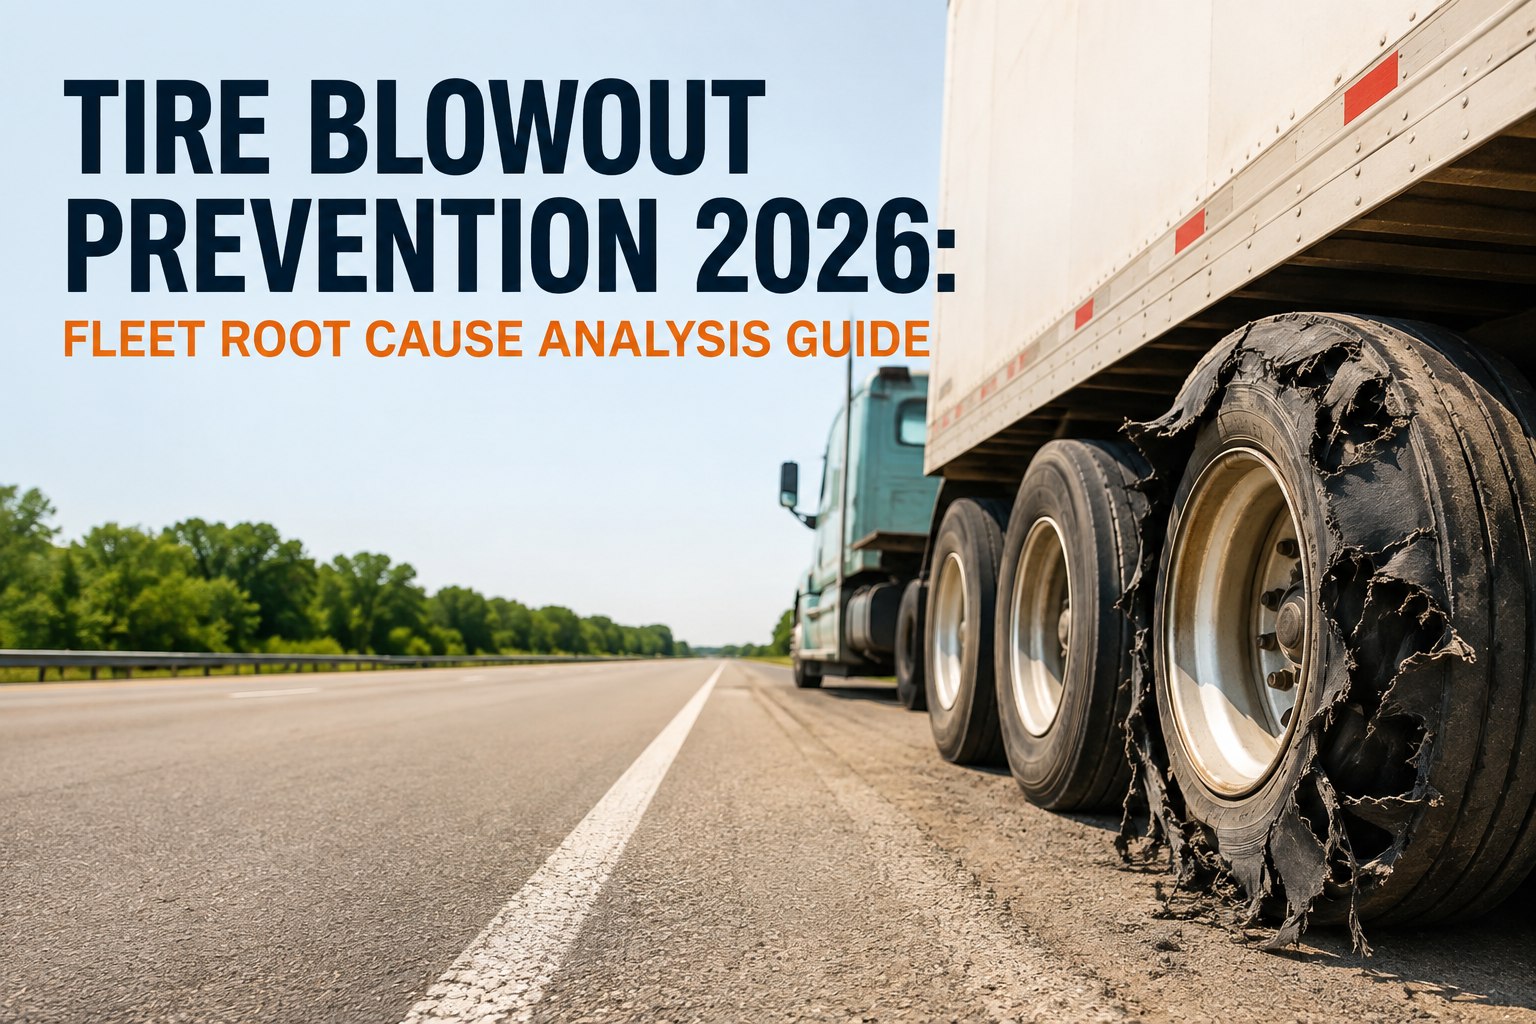
A truck tire doesn't fail without warning. It fails because someone missed the warning — a slow pressure drop, a temperature climb during a hot afternoon, a wear pattern that developed over three weeks, a load that didn't match the inflation chart. FMCSA data shows tire blowouts cause 8,000–11,000 commercial truck crashes every year, contributing to over 200 deaths. And more than 30% of commercial tire failures trace back to just two root causes: heat buildup and improper inflation. This guide walks the six failure modes, the warning signs that precede each, and the workflow that turns tire management from reactive tire-changing into predictive fleet economics. Book a demo
Six failure modes, one ranked list — underinflation causes most blowouts
Each cause has a distinct warning signature. Recognize them before the tire fails.
Tire failures aren't random events. They follow a predictable physics: pressure drops or load exceeds capacity, sidewall flexes beyond design, friction rises, temperature climbs, rubber and belts break down, tire fails. Every failure mode above traces back to some version of that chain. The good news — every step in the chain has a warning signature that fleet software and TPMS can detect before the failure itself. The whole point of a proactive tire program is intercepting the chain before rubber temperature reaches ~200°F, which is where the physics turns irreversible.
The heat chain — how underinflation actually kills a tire
Understanding the mechanical sequence is what separates a fleet that reacts to blowouts from one that prevents them. Five steps convert a low pressure reading into a highway fire.
Slow leak, temperature change, or missed inflation check. TPMS catches this stage.
Less internal pressure means the sidewall bends more with each rotation. Flex zone raises toward the bead.
Thicker rubber and steel cord near the bead generate more internal friction as they flex repeatedly.
Heat accumulates faster than it can dissipate. Approaches 175°F warning; passes 200°F breakdown threshold.
Belts delaminate, rubber breaks down, sidewall gives way. Blowout at highway speed.
The chain runs faster in summer. A 90°F ambient temperature can push asphalt surface temperature to 150°F, and a fully-loaded tire at that ambient starts closer to breakdown than the same tire in winter. This is why underinflation causes more blowouts July through September than the rest of the year combined — and why summer tire programs run on tighter pressure discipline than winter ones.
Reading wear patterns — what the tread tells you before failure
Wear patterns are the second warning system, running alongside TPMS. A tire wearing unevenly isn't just aesthetically off — it's telling you exactly which upstream cause is stressing it. Five patterns cover most fleet-tire wear diagnostics.
Both shoulders worn
Tire sags; weight shifts to edges. Generates heat — #1 blowout precursor. Fix inflation to load-chart spec.
One shoulder worn
Wheel tilted from vertical. Correct alignment and inspect suspension for worn components.
Wavy edge (cupping)
Most destructive wear pattern. Replace shocks, check bearings, balance tire.
Feathering (angled tread)
Tread smooth on one side, sharp on the other — felt by hand. 1/16″ off = tire drags 8 ft/mile sideways. Align immediately.
Localized patch
Isolated flat spot from hard braking or skid event. Check brake controller and ABS operation.
These patterns develop over weeks, not miles. A tire that's showing early both-shoulder wear at 30,000 miles is telling you the pressure discipline has been slipping. A tire that develops feathering after alignment is telling you the alignment didn't hold. Digital inspection with photo evidence per tire lets patterns get compared unit-to-unit across the fleet — and when three tractors show the same pattern in the same wheel position, something in the shop workflow is producing the issue. Book a demo to see wear-pattern photos tagged and searchable across the fleet
The 4-warning-system model — how prevention actually works
A functioning blowout prevention program relies on four warning systems running in parallel. Any one alone catches maybe half the failures. All four together catch the vast majority.
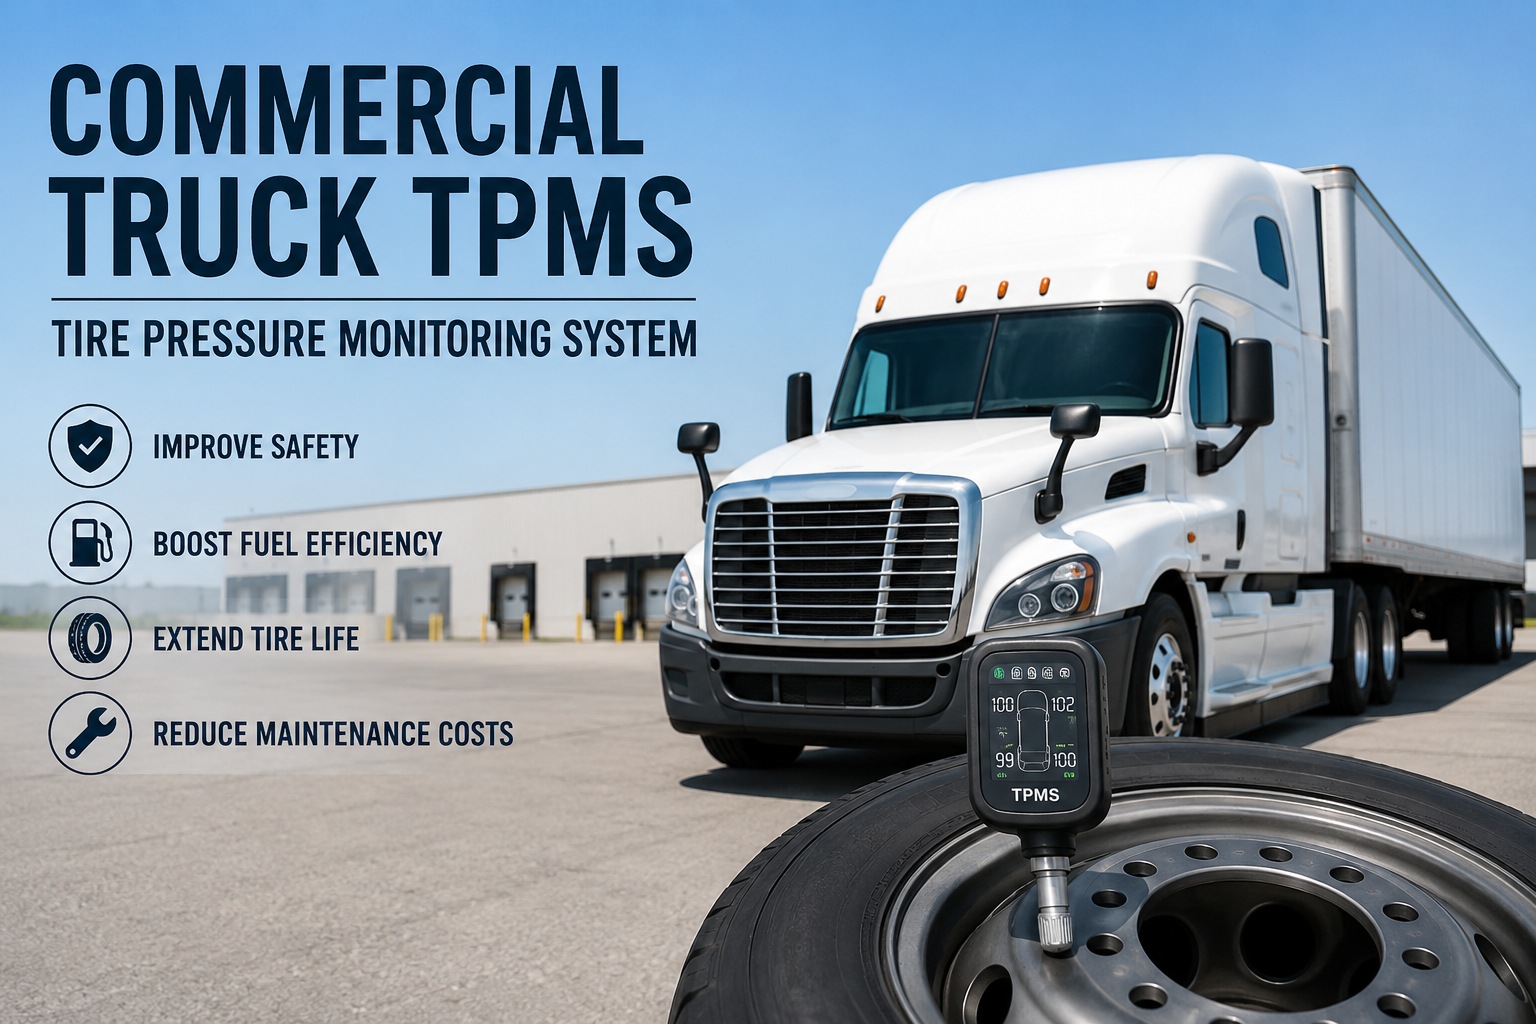
TPMS — real-time pressure & temperature
Continuous monitoring per tire. Catches slow leaks in progress, pressure loss during a haul, and temperature spikes before rubber breakdown. Doran 360-class TPMS warns at 175°F, giving drivers time to stop before 200°F breakdown threshold.
Weekly cold pressure checks
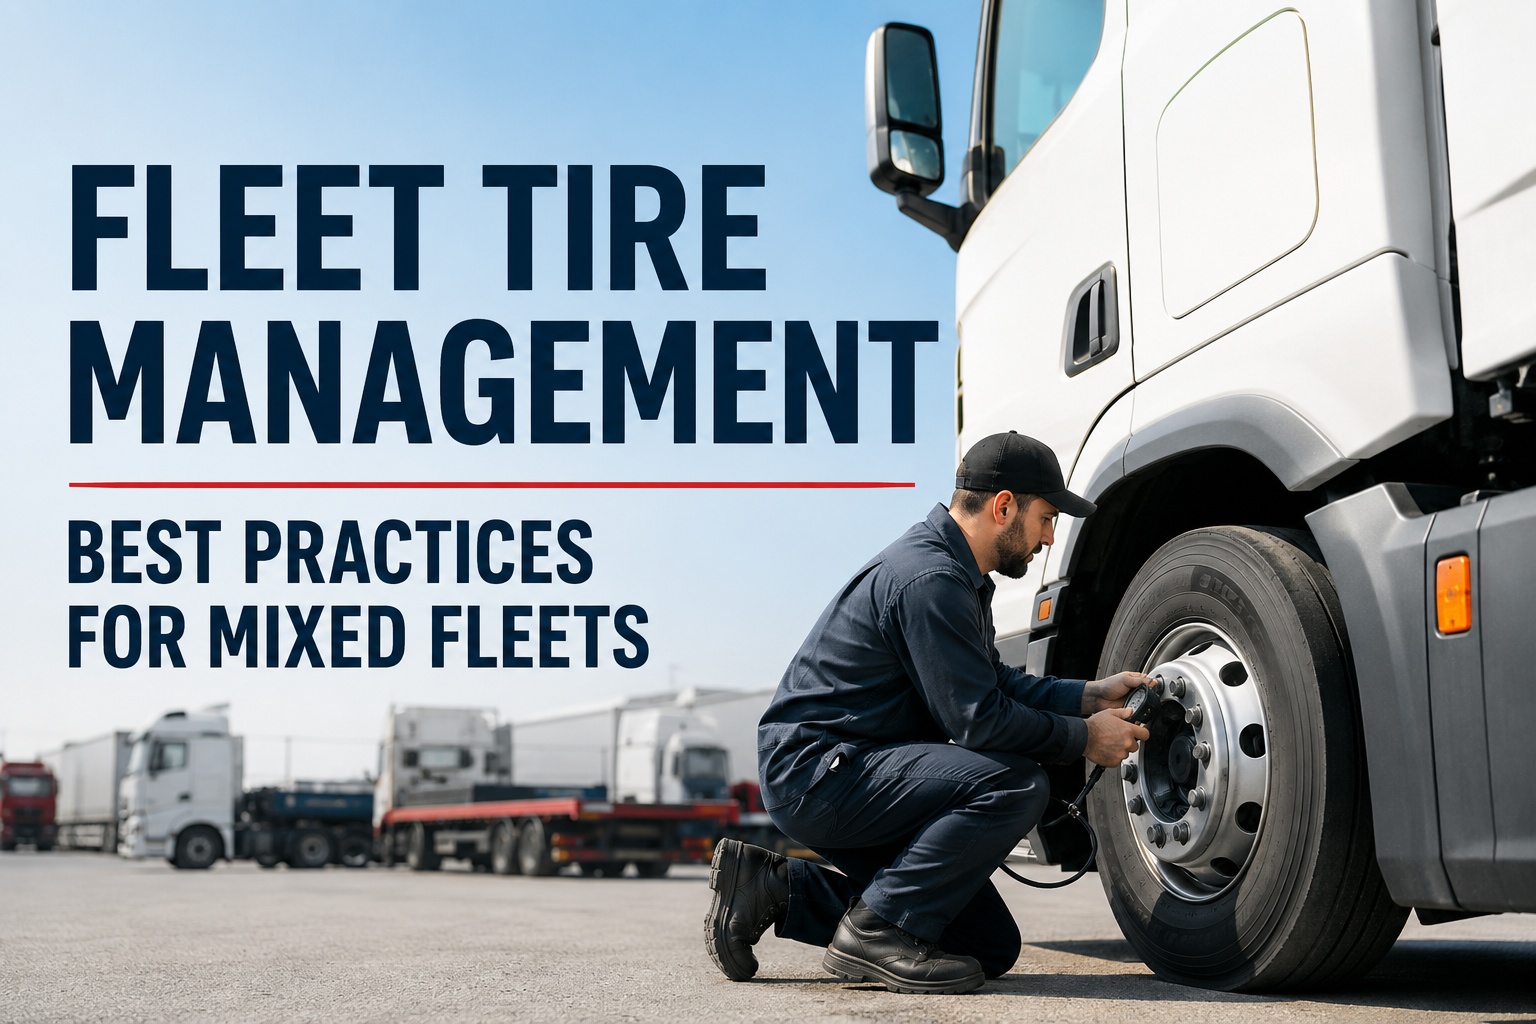
Physical gauge check per tire before driving or after 3+ hours off-duty. Load-specific inflation charts, not sidewall max PSI. Catches gradual pressure drift between TPMS alerts — the drift that's below alert threshold but still enough to accelerate wear.
Pre-trip visual inspection
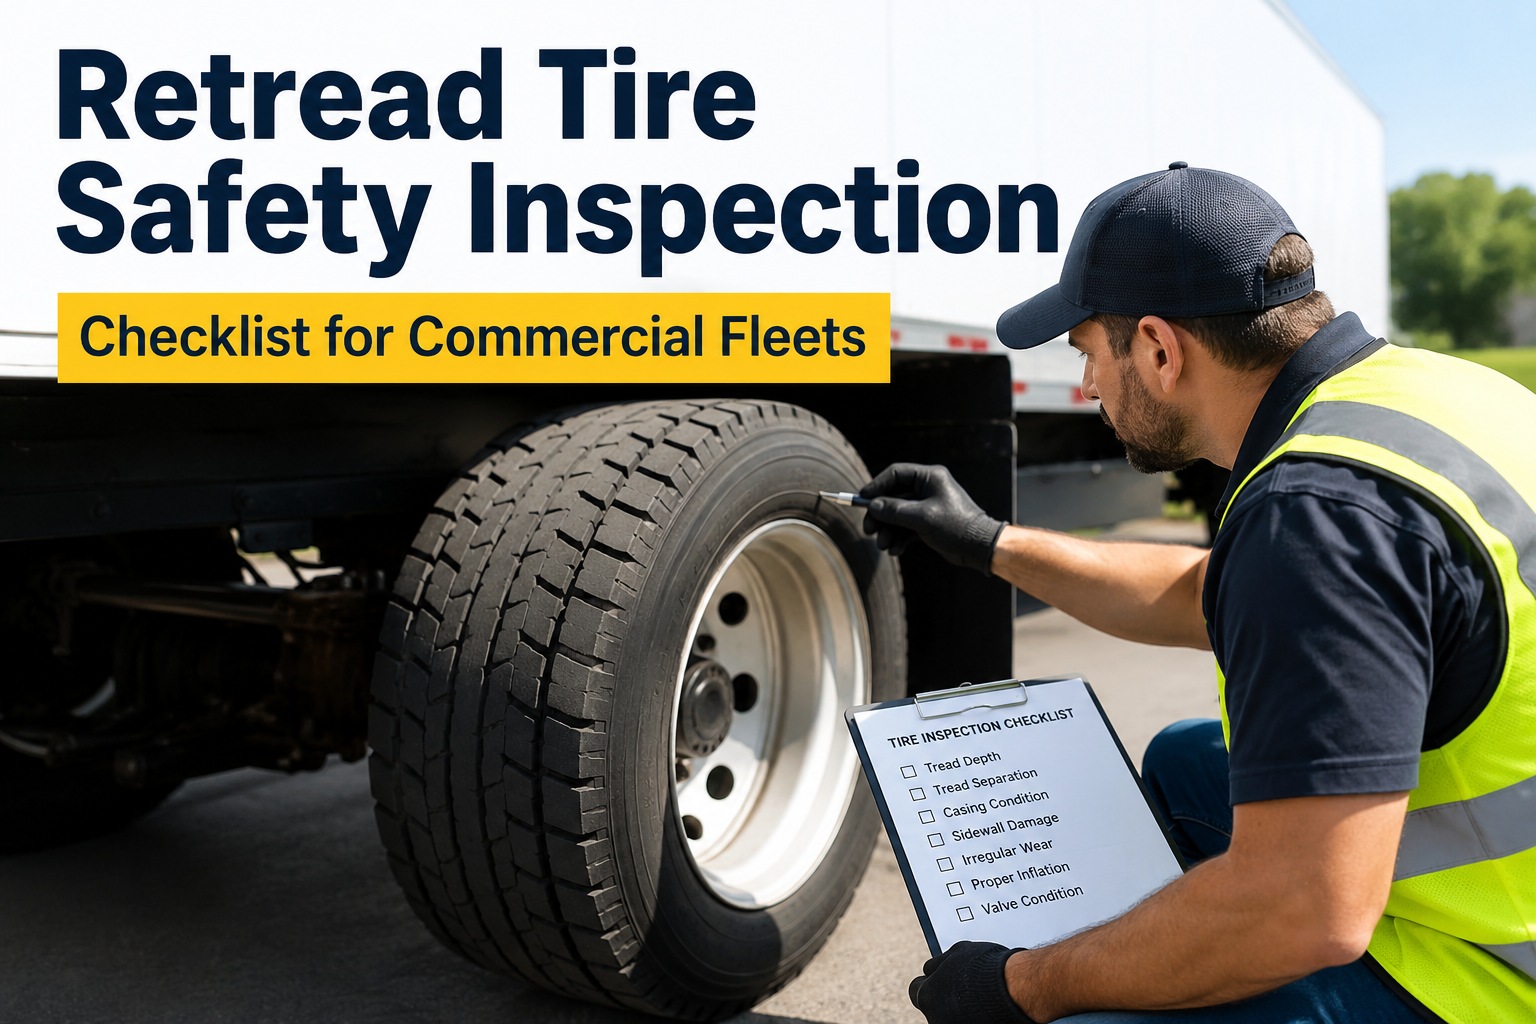
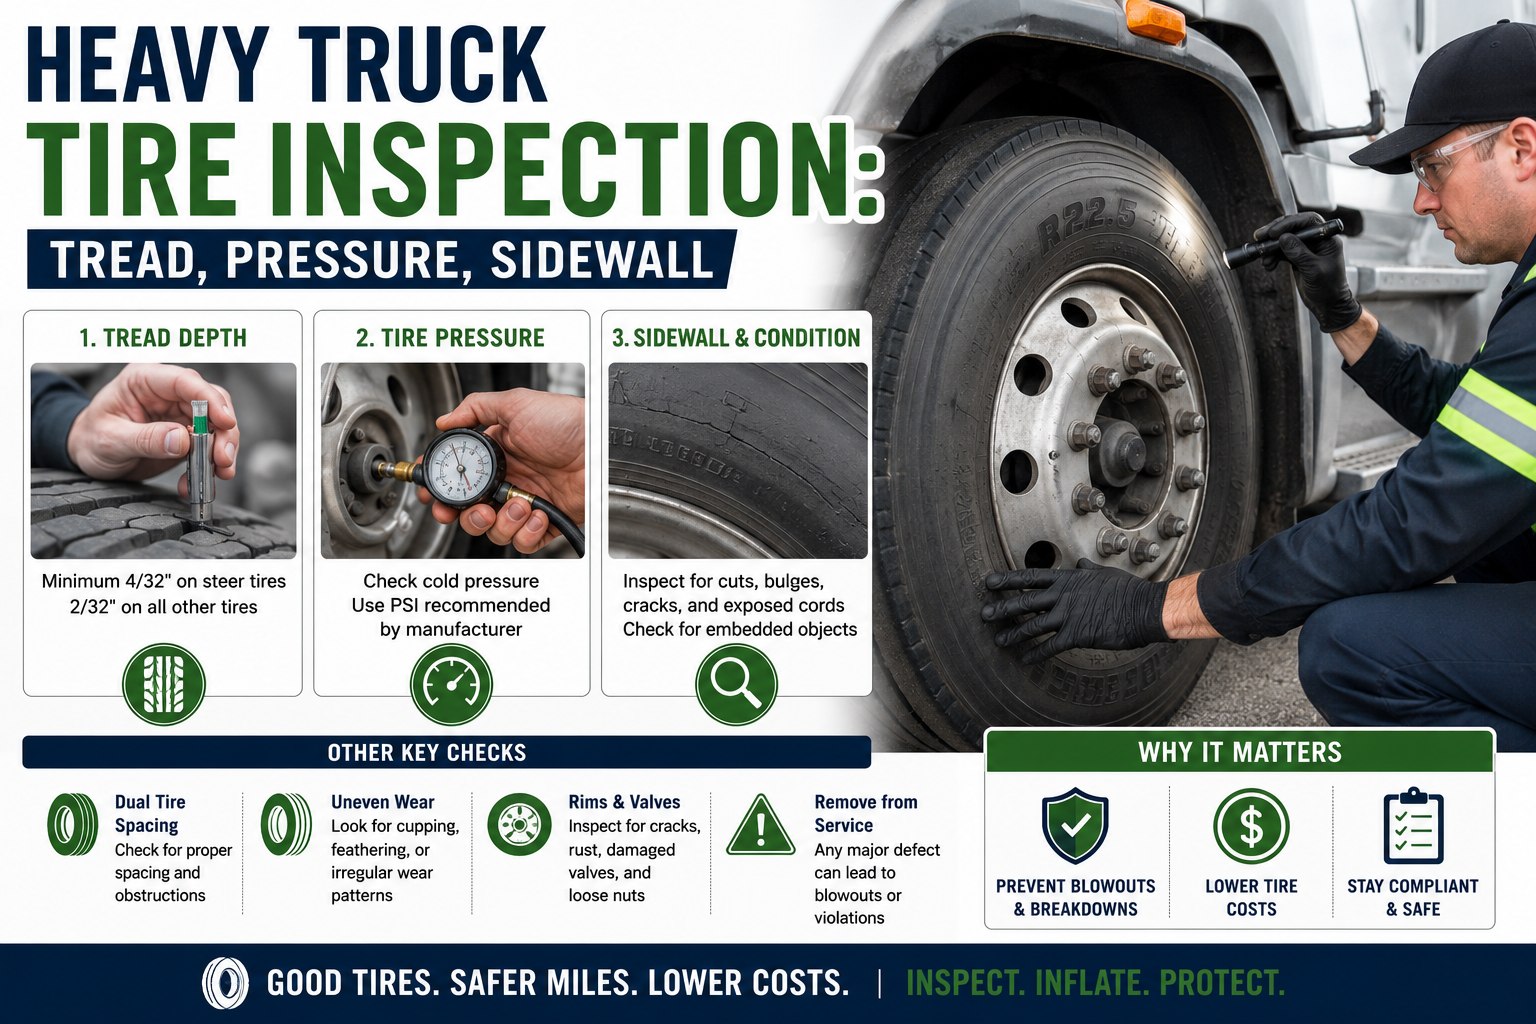
Sidewall condition, tread depth, foreign object embedment, obvious damage. Catches punctures and impact damage before they become slow leaks or sudden failures.
Wear-pattern analysis
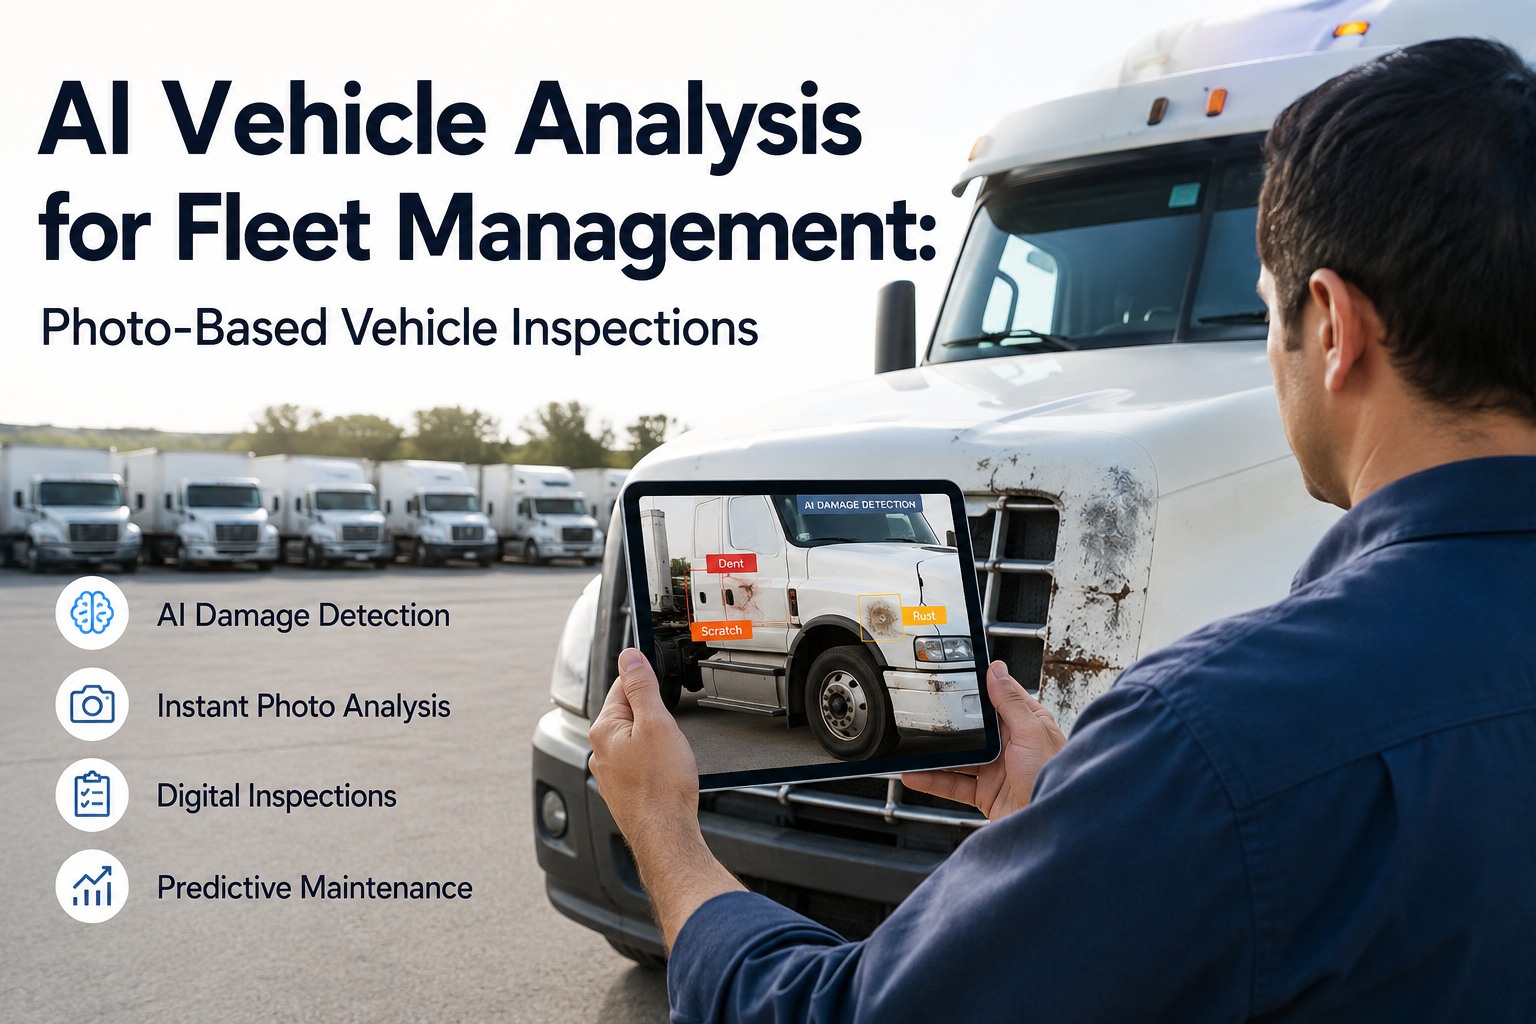
Per-tire photo record of tread wear over time. Catches upstream causes — alignment, shocks, brake issues — before they destroy the tire. This is where fleet software separates from single-vehicle inspection tools.
The economics matter. Commercial tires run ~$1,000 each, and a blowout cascade — roadside service, downtime, cargo/delivery impact, potential liability — typically costs $2,500–$10,000 per event when a truck sidelined at highway speed becomes the problem. One prevented blowout per truck per year on a 20-tractor fleet pays for the tire program tenfold over. Start free and get 4-system tire coverage on day one
The 6-step root cause analysis workflow — when a tire fails anyway
Prevention isn't perfect. When a blowout does happen, the workflow that follows determines whether the fleet learns from it or repeats it. Six steps convert a single tire failure into a systemic improvement.
Preserve evidence at the scene
Photo the failed tire in place if safe. Note position on truck. Capture cargo weight, ambient temperature, and last-known pressure reading. Evidence disappears fast in commercial tire failure investigations.
Retrieve TPMS data trail
Pull the pressure and temperature history for the failed tire from the TPMS platform. Look for the point where readings first deviated from normal.
Cross-reference inspection history
Review recent inspection records for the failed tire and the wheel position. Was there a wear pattern developing? A prior defect report? A missed corrective action?
Physical tire examination
Once the tire is off the road, examine the failure signature: heat damage patterns, tread separation location, sidewall condition, bead area. Different failure modes leave different signatures.
Determine root cause
Combine the four data streams (TPMS trail, inspection history, physical examination, operational context) to identify the actual root cause — often upstream of the failure mode itself.
Systemic corrective action
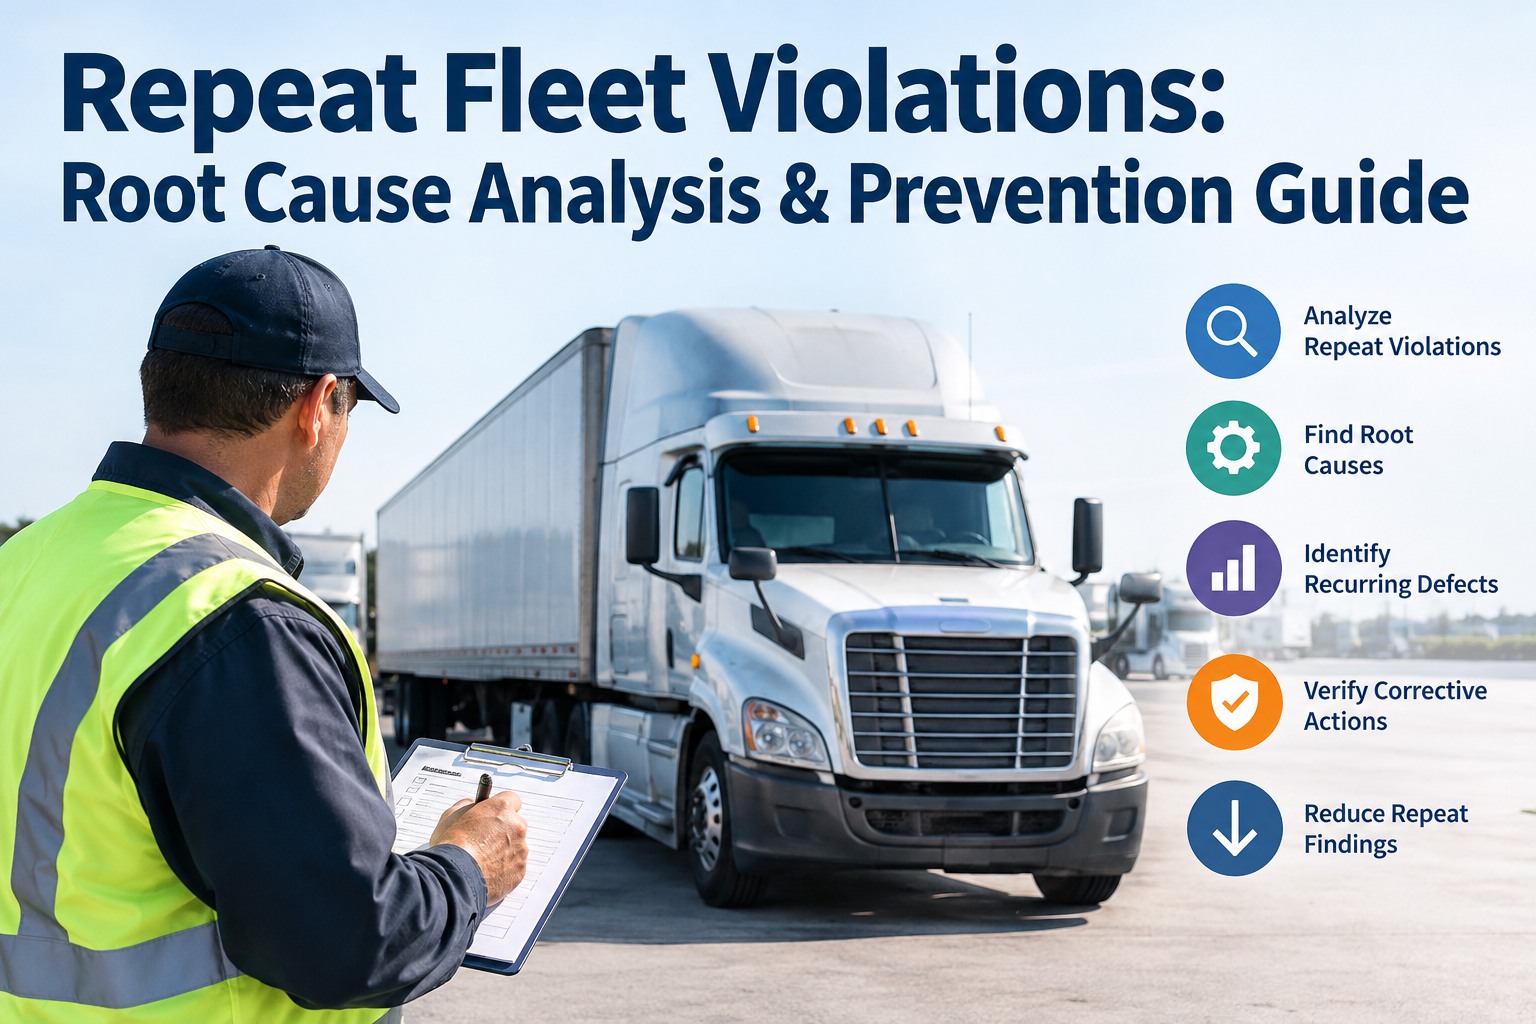
Fix the root cause across similar units in the fleet. If the failure was on a specific wheel position, check that position on other units. If it was a load-distribution issue, review the load configuration. Track recurrence.
The workflow only works if the data streams exist. Fleets running paper inspection records and no TPMS have almost no ability to run this workflow — every blowout looks like bad luck. Fleets running digital inspection with TPMS integration can identify root causes almost every time, and the same failure mode rarely repeats. That's the difference between a reactive tire budget and a predictive one.
From a Tire Manager who cut fleet-wide blowouts 68% in one year
We were averaging 14 blowout events per year across a 48-tractor fleet. Most looked random — a steer tire on one truck, a drive tire on another, sometimes a trailer position. Our shop treated each one as an isolated event. What changed the picture was pulling three years of TPMS data alongside inspection records for the failed tires.
The pattern was obvious in a week: 9 of 14 blowouts that year had a pressure drop event logged in TPMS between 3 and 21 days before the failure. Nobody had responded. The alert had gone to a dispatcher email that nobody was reading. We rerouted alerts to the shop directly, added the inflation-chart discipline to weekly checks, and started tracking wear patterns per position across the fleet. Blowouts dropped from 14 to 4 the following year — a 71% reduction. Cost avoidance was probably $60,000 in tire replacement and roadside service alone, before counting the customer impact of trucks that didn't sit on the shoulder.
Frequently asked questions
What causes commercial truck tire blowouts?
Six root causes account for the majority of commercial truck tire blowouts, ranked by frequency. (1) Underinflation and heat buildup — the leading cause per FMCSA data. When tire pressure drops below load-chart spec, the sidewall flexes excessively during rotation, generating friction and heat; rubber begins breaking down around 200°F. (2) Overloading and improper load distribution — load beyond tire capacity or uneven distribution forces the tire to work at effective pressures below its rated spec, triggering the same heat-flex cycle. (3) Tread separation — internal belt-to-tread bond weakens from heat cycles, age, or manufacturing defect; warning sign is vibration that worsens with speed. (4) Zipper failures — sudden circumferential sidewall breaks, especially on retreads, often from prior undetected sidewall damage. (5) Sidewall damage and punctures — road hazards, curb strikes, foreign object impact. (6) Age and service condition — tires past manufacturer service life (often 5-6 years regardless of tread) lose rubber elasticity and become more prone to all other failure modes. FMCSA data attributes over 30% of commercial tire failures specifically to heat buildup and improper inflation combined. Tire blowouts cause approximately 8,000-11,000 commercial truck crashes annually, representing about 6% of all truck crashes, and NHTSA estimates over 200 deaths per year. Under-inflation is often the actual root cause even when the visible failure signature looks like tread separation or zipper failure — because the underlying heat chain traces back to inadequate pressure discipline.
How does underinflation cause a blowout?
Underinflation kills a tire through a predictable five-stage heat chain. Stage 1: pressure drops below load-chart spec, from slow leak, temperature change, or missed inflation check. Stage 2: sidewall flexes more than design because less internal pressure supports it; the flex zone raises closer to the bead where the sidewall rubber is thicker and steel-cord density is higher. Stage 3: friction rises because the thicker rubber and steel cords near the bead generate more internal friction as they repeatedly flex against each other. Stage 4: temperature climbs because heat accumulates faster than it can dissipate through the tire's surface; TPMS temperature sensors typically warn around 175°F, and tire rubber begins structural breakdown around 200°F. Stage 5: structural failure — belts delaminate from the tread, rubber compounds break down, sidewall gives way, and the tire fails catastrophically at highway speed. Summer accelerates the whole chain: 90°F ambient temperature produces 150°F asphalt surface temperature, and a fully-loaded tire at that ambient starts closer to breakdown than the same tire in winter. This is why underinflation-related blowouts spike July through September in most US operating regions. The countermeasures are direct: load-specific inflation charts (not sidewall max PSI), weekly cold pressure checks before driving or after 3+ hours off-duty (warm tires read artificially high), and continuous TPMS monitoring to catch slow leaks between manual checks. Industry research shows that US DOT estimates underinflated tires waste approximately 5 million gallons of fuel daily nationwide, and that underinflation increases rolling resistance approximately 20% — making inflation discipline both a safety and a fuel-economy investment.
What are the warning signs before a tire blowout?
Most blowouts have warning signatures that show up days or weeks before the failure. The warnings run in four parallel systems, and the failure typically happens when all four have been missed. (1) TPMS data — pressure drops (fast or slow), temperature climbs approaching 175°F warning threshold, and pressure/temperature diverging from the historical baseline for that tire. In one industry pattern, roughly two-thirds of blowouts had a pressure drop event logged 3-21 days before failure that nobody responded to. (2) Physical inspection — sidewall damage, visible foreign object embedment, punctures, unusual wear patterns, and any tire that "feels different" during walkaround. (3) Wear patterns — both shoulders worn faster than center indicates chronic underinflation; one shoulder worn indicates camber misalignment; wavy edge indicates worn shocks or bad bearings; feathering (angled tread) indicates toe misalignment (1/16-inch off = tire drags 8 feet per mile sideways); localized patches indicate wheel lockup or brake issues. (4) Driver perception — vibration that worsens with speed is the classic tread-separation warning; unusual noise, pull, or handling change; and reduced braking response. Recognizing any of these warnings and acting on them is the difference between prevention and a highway incident. Fleets running digital inspection with TPMS integration can detect and correlate all four warning streams; fleets running paper inspection with no TPMS typically catch only the most obvious visible warnings, and even those are often lost in the paperwork before someone responds. This is what turns tire management from reactive tire-changing into predictive fleet economics.
How does a fleet build a tire blowout prevention program?
A functioning blowout prevention program relies on four warning systems running in parallel, with a defined workflow for when a failure occurs anyway. System 1: TPMS with real-time pressure and temperature monitoring per tire, alerts routed to shop and dispatch (not lost in individual email inboxes), and defined response procedures for each alert type. System 2: weekly cold pressure checks per tire, performed before driving or after 3+ hours off-duty, using load-specific inflation charts rather than sidewall max PSI. System 3: pre-trip visual inspection covering sidewall condition, tread depth, foreign object embedment, and obvious damage — documented on DVIR per 49 CFR 396.11. System 4: wear-pattern analysis with per-tire photo records over time, so patterns can be tracked per position across the fleet and upstream causes (alignment, shocks, brake issues) get caught before they destroy tires. When a blowout does happen despite the four systems, a 6-step root cause analysis follows: preserve evidence at the scene, retrieve TPMS data trail for the failed tire, cross-reference inspection history for the position, physically examine the failure signature, determine root cause by combining the data streams, and implement systemic corrective action across similar units in the fleet. Economics justify the program directly: commercial tires run approximately $1,000 each, and a blowout cascade including roadside service, downtime, cargo/delivery impact, and potential liability typically runs $2,500-$10,000 per event. One prevented blowout per truck per year on a 20-tractor fleet pays back the tire program tenfold over.
How does HVI support fleet tire blowout prevention?
HVI combines digital tire inspections with TPMS data feeds so pressure trend history, temperature warnings, and physical wear patterns surface together per tire per wheel position. When a specific wheel-end pattern appears on multiple units, it flags automatically for shop review — the fleet-wide pattern detection that separates predictive maintenance from reactive tire replacement. Corrective actions are assigned to specific mechanics with photo-verified completion, so a documented tire defect doesn't slip through the workflow. Per-tire wear-pattern photos are preserved across inspections, letting mechanics compare Week 1 tread condition against Week 6 to catch developing patterns before they destroy the tire. Load-specific inflation charts are configured per unit and per axle, so drivers see the correct target pressure for the actual load — not just the sidewall max. TPMS alerts route to shop and dispatch simultaneously with defined response procedures, eliminating the "alert went to an email nobody reads" failure mode that Lisa M.'s carrier experienced. When a blowout does happen, HVI produces the full data trail (pressure history, temperature warnings, inspection records, wear-pattern photos) needed for root cause analysis and defensible documentation for any liability review. Published customer data shows fleets on HVI report approximately 25% lower annual maintenance cost with typical payback around 3 months, and for fleets with meaningful tire blowout exposure, the avoided event costs alone typically pay back the software within the first prevented failure.
Every blowout has a warning signature. Every warning missed is a preventable failure. Turn the warnings into action.
HVI runs the 4-warning-system model — TPMS + cold pressure checks + pre-trip visual + wear-pattern analysis — with corrective actions and full audit trail. Live in under two weeks. One prevented blowout per truck per year pays for the tire program tenfold.
No credit card · Tire management templates ready on day one