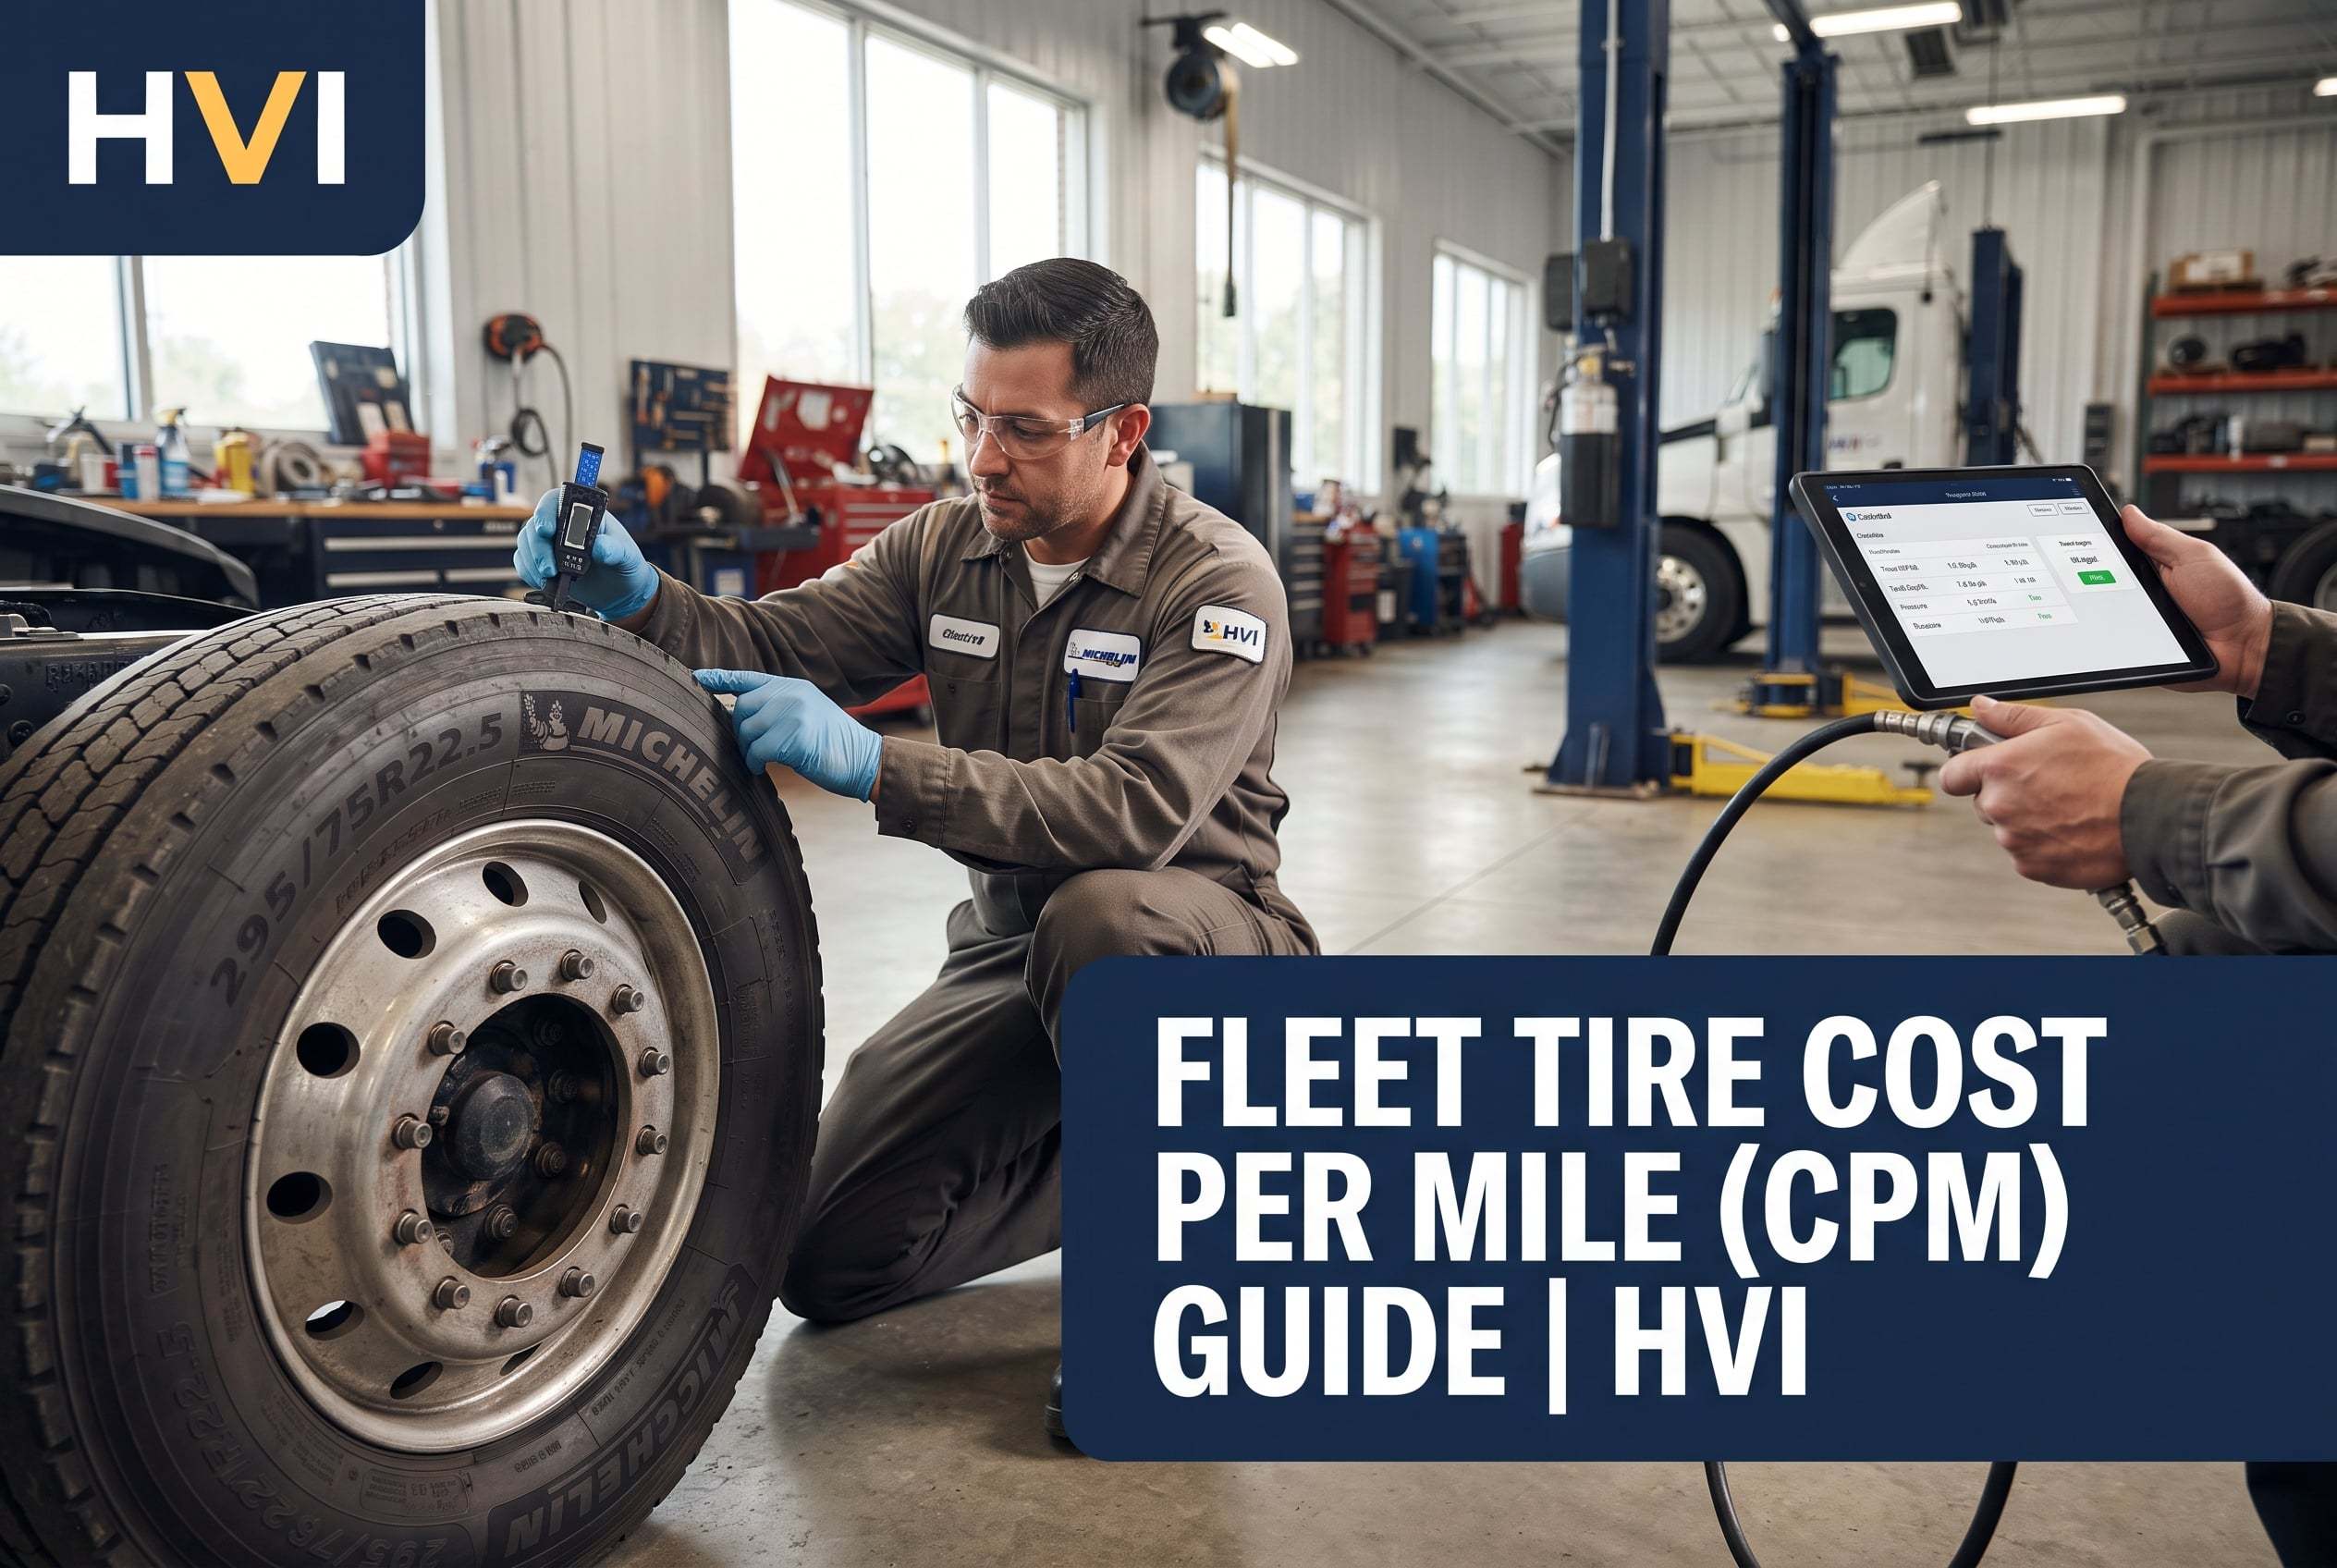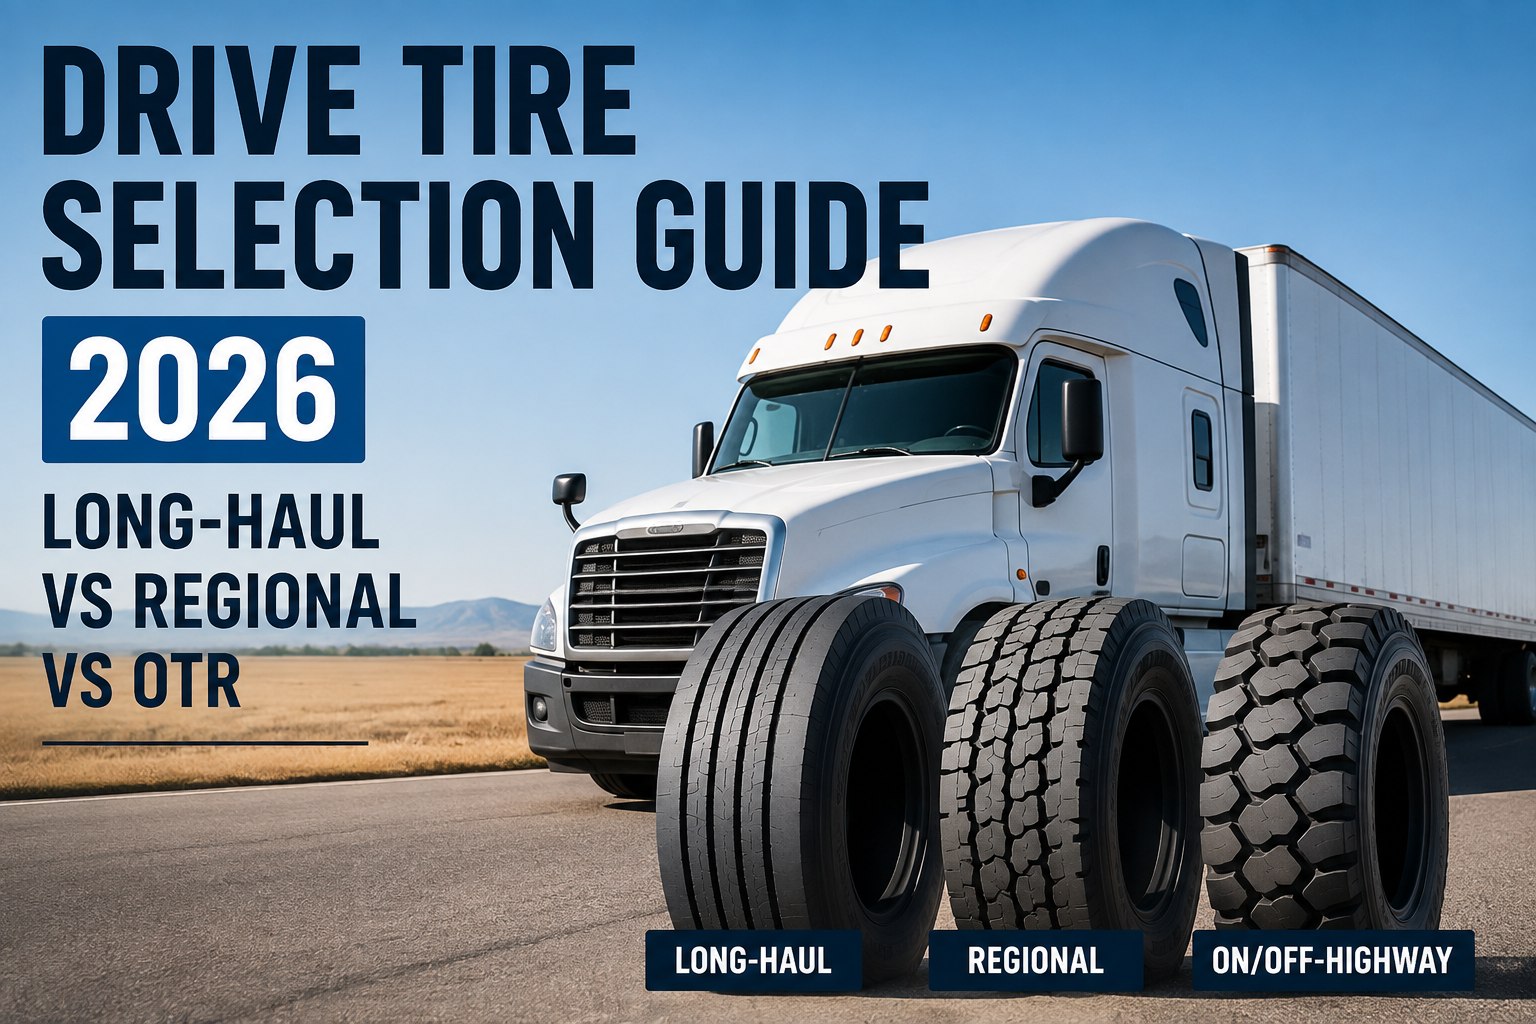
Ask a tire salesperson which drive tire is best and you get a brand. Ask a fleet manager with 30 years of tire data on their desk and you get a duty cycle. The best drive tire for a truck running 130,000 highway miles between Chicago and Dallas is not the best tire for one pulling 40,000 pounds up a logging road. This drive tire selection guide compares long-haul, regional, and on/off-highway tires by tread, compound, mileage, warranty, and true cost per mile. Book a demo
Three duty cycles. Three tire designs. One wrong choice can cost you 40,000 miles per casing.
Drive tires cost $350 to $650 each. Multiplied by 8 tires per tractor and 100 tractors per fleet, the wrong drive tire on the wrong route is a six-figure annual miss. The right tire on the right cycle stretches every casing 20-30% and adds a retread generation.
The duty-cycle spectrum — where does your operation actually live?
Every commercial drive tire on the market is engineered for a specific point on the duty-cycle spectrum. The spectrum runs from pure highway (100% smooth pavement, high speed, low scrub) to pure off-road (loose surfaces, sharp rocks, low speed, high torque). Most drive tires target one of three zones on that line — and the further you push a tire outside its zone, the faster it fails.
Tread pattern anatomy — rib, lug, closed shoulder, open shoulder
Every drive tire on the road today falls into one of two basic tread architectures: rib or lug. Rib patterns feature continuous grooves running around the tire and are used mostly on steer and trailer positions. Lug patterns break the tread into blocks separated by lateral grooves — the design that gives drive tires their traction. Every drive tire is a lug pattern; the variation is in how the shoulder is treated and how deep the lugs are cut.
Continuous rib around the outer edge of the tread with lug blocks in the center. Fuel-optimized. Even shoulder wear over the life of the casing. Ideal for high-mileage highway operations where scrub is minimal and traction demands are moderate.
Lug blocks extend to the outer edge with no continuous rib. Better wet, mud, and snow traction. Higher rolling resistance than closed shoulder, and more prone to irregular shoulder wear if inflation isn't disciplined. Ideal for regional and mixed-duty operations where traction matters.
Deep, widely-spaced lug blocks with self-cleaning grooves. Cut-and-chip-resistant compound. Delivers the traction and durability required in mixed-surface duty at the cost of fuel efficiency. Ideal for construction, aggregate, logging, and other on/off-highway operations.
The shoulder decision is the biggest single lever in drive tire selection. Closed-shoulder tires on a regional route lose their shoulders in half the expected miles; open-shoulder tires on a pure highway route burn 3-5% more fuel than needed for the entire life of the casing. Match the shoulder design to the duty cycle.
The three drive tire archetypes — specs, tread, and where each one wins
Every drive tire brand builds a version of each of these three archetypes. Michelin's XDA, XDS, and XDY families. Bridgestone's M710, M726, and M729. Continental's HDL, HDR, and HDO lines. The names differ; the engineering categories don't.
OTR dry van, reefer, and dedicated highway fleets running 100K+ miles/year. Interstate corridors. Loaded miles > 80% of duty cycle.
Shallow tread and low-RR compound trade traction for fuel savings. Poor performance in mud, snow, and rough pavement. Wears fast on regional stop-and-go.
Regional LTL, P&D, food-service, beverage, and construction-hauling fleets running 30-80K mi/year with mixed highway + local. Frequent stops, tight turns, variable weather.
Higher rolling resistance costs 2-3% in fuel economy vs long-haul. Traction and durability come at a fuel penalty. The right choice for the mixed-cycle operation.
Construction, aggregate, logging, oil/gas, mining haul roads, and municipal snow/refuse. Mixed pavement and dirt/gravel/site. Cut, chip, and puncture resistance override fuel efficiency.
Highest rolling resistance. 5-8% fuel penalty vs long-haul on highway miles. Aggressive tread required for the environment — using anything softer means shredded casings.
Selecting between the three archetypes is not a matter of picking the "best" tire in absolute terms — it's matching the tire's engineered strengths to the actual duty cycle of the truck. A long-haul tire optimized for 80% highway use will physically wear differently under 40% highway use, and that difference shows up on the shoulders 30,000 miles before the tread cap is spent. Book a demo to see per-tire wear tracked against the drive tire type installed
Cost per mile shootout — the number that matters most
Sticker price is a distraction. Cost per mile is the number that decides tire economics. A $650 long-haul tire that delivers 250,000 miles costs less per mile than a $400 regional tire that delivers 120,000 miles on the same highway route. Below is the honest 2026 shootout at fleet-realistic mileages.
| Tire type | New price | Retread price | Total cycle miles | Total spend | Cost per mile |
|---|---|---|---|---|---|
| Long-haulHighway duty | $550 | $180 | 500K | $910 | $0.0018 |
| RegionalMixed duty | $475 | $165 | 380K | $805 | $0.0021 |
| On/off-highwaySite duty | $600 | $220 | 200K | $820 | $0.0041 |
| Long-haul on regionalWrong-fit | $550 | — (rejected) | 160K | $550 | $0.0034 |
Every fleet should compute this table for its own duty cycle at least annually. The number that gets budgeted (sticker price times replacement count) is rarely the number that matters (total spend per revenue mile). Book a demo to see per-tire CPM trended fleet-wide by position and route
The mileage warranty — what it actually protects and what it doesn't
Every commercial drive tire ships with a mileage warranty. Very few fleets ever collect on one. The reasons why matter more than the warranty number itself.
Prorated replacement if the tire wears out (to 2/32") before the promised mileage — and only if the manufacturer's maintenance requirements were followed exactly. Pressure records. Rotation records. Alignment records. Documented per-tire history.
Road hazards, cut/chip damage, chronic underinflation, missed rotations, alignment issues, overload, and irregular wear patterns. Roughly 80% of premature drive-tire failures fall into these buckets — and the manufacturer will decline the claim.
Fleets with complete per-tire maintenance records collect on legitimate claims. Fleets without them don't — regardless of how the tire failed. The warranty is a records-management program disguised as a product warranty.
The mileage warranty on the sticker is aspirational. The mileage the fleet actually achieves depends 90% on inflation discipline, rotation, alignment, and load management — the same fundamentals that determine cost per mile in the first place. Start free and build the per-tire records that actually collect warranty claims
From a purchasing manager who compared 4 drive tire brands over 3 years
We ran a controlled test: 40 tractors on identical Midwest OTR routes, 10 each on four different premium drive tire brands. Documented pressure weekly, rotation at 40K, tread readings monthly. Three-year data collection. Brand A had the best sticker mileage warranty. Brand C had the best fuel economy in the brochure. Brand D was the "budget" premium tier.
Actual CPM after 3 years: Brand D came in second on cost per mile despite being the cheapest sticker, because the retread rejection rate was 8% higher and we lost more casings. Brand A won on total CPM even though its per-tire price was 18% higher — the retreads came back cleaner and we got a full third life out of them. The takeaway isn't which brand won; it's that we couldn't have made the decision without three years of per-tire data. The fleet that picks tires on brochure claims is guessing.
Frequently asked questions
What's the difference between long-haul, regional, and on/off-highway drive tires?
The three drive tire categories are engineered for different duty cycles and differ in tread depth, compound, and shoulder design. Long-haul drive tires are optimized for interstate use at fleets running 100,000+ miles annually. Shallow tread (24-26/32"), closed-shoulder design for even wear, and low-rolling-resistance compound for fuel economy. Typically SmartWay-verified. Best when highway miles exceed 80% of duty cycle. Regional drive tires handle mixed highway plus local operations at fleets running 30,000-80,000 miles annually. Deeper tread (28-30/32"), open-shoulder lug design for traction in variable weather, and a balanced compound that handles both highway heat and stop-and-go scrub. This is the right tire for LTL, food service, beverage, and most municipal operations. On/off-highway drive tires are built for mixed pavement plus dirt, gravel, or job-site duty. Aggressive lug tread (30-34/32"), cut-and-chip-resistant compound, and wide grooves for mud and rock evacuation. Best for construction, aggregate, logging, oil and gas, and severe-duty municipal fleets. The wrong tire on the wrong duty cycle typically loses 30-40% of expected life and forfeits the retread cycle.
What tread depth does a new drive tire have and when should it be pulled?
New drive tires ship with tread depth ranging from 24/32" for long-haul highway tires up to 34/32" for aggressive on/off-highway lugged tires. Regional drives sit in the middle at 28-30/32". DOT regulation (49 CFR 393.75) sets the drive axle minimum at 2/32" of tread depth — below that the vehicle is out-of-service on any CVSA inspection. However, running to the DOT minimum forfeits the retread cycle. The optimal pull point for retreadable drive tires is 4/32", which preserves enough casing integrity for a certified retreader to accept the casing and apply new tread. Pulling at 4/32" and retreading captures the largest portion of the casing's lifetime economic value. Fleets pulling at 2/32" or running to failure are throwing away roughly $250-$400 per casing in retread value. Tread depth should be measured at three points across the tread (inner, center, outer) at every PM interval to catch developing wear patterns that indicate alignment, inflation, or suspension issues before they cost a tire. Three-point tread reading is what separates programs that catch problems in time from programs that discover them at replacement.
How do you calculate cost per mile for drive tires?
Cost per mile (CPM) for drive tires captures all costs across the full casing lifecycle divided by total miles delivered. The formula: total spend per casing (new tire price plus all retreads) divided by total miles delivered (new life plus retread lives). A worked example: a long-haul drive tire at $550 new, retreaded twice at $180 each, delivering 200K new + 150K + 150K = 500K total miles, costs $910 total for 500K miles = $0.0018 per mile. Compare against a wrong-fit long-haul tire on a regional route that gets 160K miles new and fails retread inspection at the shoulders: $550 for 160K miles = $0.0034 per mile — nearly 2x the CPM despite the same sticker price. The four cost components fleets often miss: (1) mounting and dismount labor at $50-$75 per tire, (2) roadside failure events at $500-$1,000 each, (3) rejected casings at retreader (typically 10-15% of pulls), and (4) the value of retread cycles forfeited when tires are pulled too late. Fleets tracking CPM per position per truck typically find their real CPM is 15-25% higher than what they quote from memory. That gap is where drive-tire selection decisions get made confidently — or not.
Do drive tire mileage warranties actually pay out?
Rarely, and almost never to fleets without documented per-tire maintenance records. Every commercial drive tire ships with a mileage warranty (typically 150,000 to 300,000 miles depending on tire tier). The warranty covers prorated replacement if the tire wears out before the promised mileage — but only under the manufacturer's strict maintenance conditions. Coverage typically requires documented pressure records showing weekly checks at spec, documented rotation records per interval, alignment records within tolerance, and inspection records showing no chronic underinflation or overload. What the warranty explicitly does not cover: road hazards, cut and chip damage, chronic underinflation, missed rotations, alignment issues, overload conditions, and any irregular wear pattern. Roughly 80% of premature drive tire failures fall into these excluded buckets — and manufacturers deny those claims. The result: fleets with complete per-tire maintenance data collect on legitimate claims regularly. Fleets running paper records or "the tire failed" notes without documented maintenance history collect essentially nothing. The mileage warranty is fundamentally a records-management program disguised as a product warranty. Building the per-tire records is what unlocks the coverage — and coincidentally, is what also gets the CPM number right.
How does HVI help fleets select and manage drive tires?
HVI tracks every drive tire by serial number, wheel position, mount date, and duty cycle. Three-point tread depth is captured at every PM (inner, center, outer). Pressure is captured on every driver walkaround. Wear patterns are flagged automatically so tire selection decisions can be validated against actual fleet data instead of manufacturer brochures. The cost-per-mile dashboard aggregates all tire spend (new, retread, mounting, roadside events) across total delivered miles per truck and per axle position, so purchasing decisions are grounded in measured CPM rather than sticker price. When a new tire model is trialed on a subset of the fleet, HVI produces per-casing performance comparison against the incumbent brand — the same controlled-test methodology purchasing managers like Sara L. use to make brand decisions worth six or seven figures across the fleet. The maintenance records that unlock warranty claims (documented pressure, rotation, alignment, and inspection history per tire) are captured automatically as byproducts of normal PM discipline. For fleets running 100+ tractors, the CPM dashboard alone typically identifies $30,000-$80,000 annually in tire-selection or duty-cycle-mismatch waste that was invisible before. Book a demo to see per-tire CPM tracking built into the fleet dashboard.
The best drive tire for your fleet is measured, not marketed. HVI does the measuring.
Track cost per mile per tire, per position, per truck. Compare brand performance on your actual routes. Build the records that collect warranty claims and validate tire selection with data instead of brochure claims.